
Send this article to a friend:
December
05
2023

|
Send this article to a friend: December |
|
US Trade deficit 2024
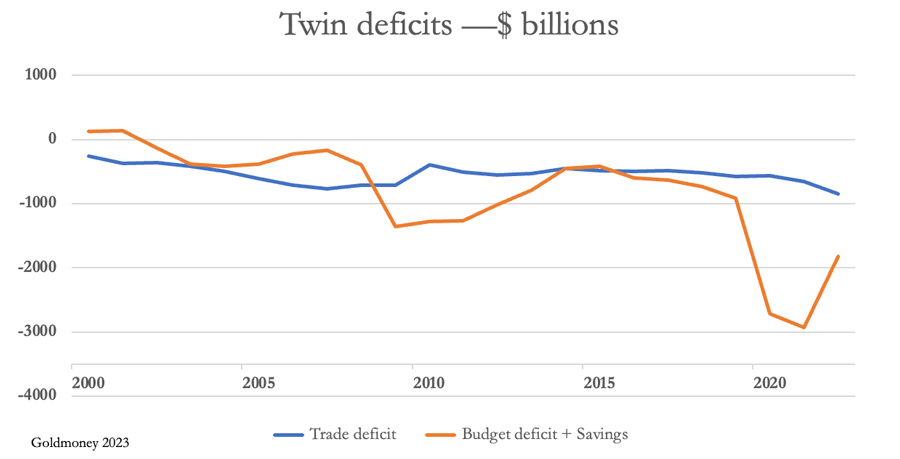
In this article, I explain why the twin deficit hypothesis will apply, bearing in mind a likely budget deficit outturn of $3 trillion and a negative savings rate. The extent to which politics demands protectionism will drive consumer prices higher than they otherwise would be. Put another way, the purchasing power of the dollar faces a renewed decline. A falling value for dollar credit as America enters a recession which promises to be deep is the worst outcome for policy makers faced with funding a soaring budget deficit. Other than tame buyers in offshore financial centres, major holders are turning sellers, not just of dollars, but US Treasuries as well. The developing recession is global, and the days when a balance of payments for the dollar persisted despite large trade deficits are probably over. Soaring trade deficits for spendthrift nations at a time of contracting international trade will brings enormous pressures and something has to give. And that something will prove to be highly inflationary. It is an adverse wind fanned by geopolitical considerations threatening massive, long dollar positions in non-US hands. Together with onshore dollars and dollar investments totalling $33 trillion, there is additional offshore exposure in foreign exchange forwards, FX, and currency swaps. Add in eurobonds and total dollar credit amounts to over $125 trillion – over four and a half times US GDP. Is the new declining trend in the dollar’s trade weighted index the beginning of the dollar’s final collapse? In the coming months massively long dollar positions are likely to be closed, not just by the import/export trade, but by speculators who have swapped yen and euros for dollars looking to close out their positions before currency losses mount. It is a situation with the potential to destroy all value in dollar credit in very short order. The background to trade wars There is little doubt that the US is increasingly autarkical with respect to trade. It appears to be part of a wider trend, with complex supply chains spreading into foreign territories increasingly seen as a political and commercial risk. Supply trend diversity was a trend that started in earnest with the financialisation of western capital markets in the mid-eighties, while adopting Japanese just-in-time production and inventory management methods. In the advanced economies, capital was being redirected from non-financial to financial activities. And at the same time, it was far cheaper and quicker for manufacturers to establish and operate factories in Southeast Asia than to invest in similar projects at home. There were no unions getting in the way of modernisation of production, and quick-learning unskilled labour operating automated machinery was readily available. A factory could be up and running in the jungle from scratch in a year or two, whereas in the West building production facilities from planning through implementation and to final production was increasingly bureaucratic and time-wasting. China became a major beneficiary of this foreign investment, which revolutionised her economy following decades of Maoist isolation. The Communist Party embraced the opportunities capitalism offered. Along with other developed economies, America initially welcomed China’s conversion to capitalism and her integration into the global economy. It was another source of cheap production facilities for American business interests and was immensely profitable. China’s strong savings culture funded home-grown production, construction, and technological development. Aware that it made sense to diversify from the risks of being the G7’s most important source of cheap goods, her government’s attention turned to the development opportunities offered in Asia as well as those from her commodity and energy suppliers elsewhere. China’s evolutionary development began to tread on American toes, coming to a head in President Trump’s administration. Trump had been elected on an emotional promise to bring American production back home — the beginning of US autarky. China became the target of discriminatory trade tariffs, which were meant to reduce the disparity in the balance of trade between the two nations. In his quest to Make America Great Again and in denial of the benefits China gave American consumers, Trump embarked on a progressively anti-Chinese trade war. With this new trade war set in motion, the US Government also became increasingly concerned over the threat China posed to America’s technology leadership. In 2015, as an extension to China’s thirteenth five-year plan, she confirmed an official objective in a twenty-five year plan to evolve from being a manufacturer of goods for export, into a technology-led economy. The mistake was to openly declare that Chinese companies would be favoured, and foreign entities excluded. In the context of a developing trade war, it was undiplomatic to say the least. And for Trump, it was a red flag. The Americans regarded themselves as the world’s technology leaders and were hyper-sensitive to any threats to their position. An anti-China propaganda campaign ensued, condemning China’s policy against the Uyghurs which until then had attracted little attention. The Chinese government was cast as evil and that America was on the democratic and moral high ground. An area of focus for the Americans was the remarkable success of Huawei in developing 5G mobile technology. They issued an arrest warrant for the detention of Meng Wanzhou, daughter of Huawei’s founder, on suspicion that she had violated US sanctions against Iran. After house arrest in Vancouver while the lawyers argued it out, all charges against her were finally dropped in September 2021. In early 2020 came covid and its lockdowns. Covid was quickly attributed to a live animal market in Wuhan, or alternatively having escaped from Wuhan’s Institute of Virology. Again, this “unfair” trade partner, which was allegedly responsible for decimating America production was in the West’s political crosshairs. The subsequent disruption to supply chains took a considerable time to sort out, hitting US corporations with global manufacturing operations hard. A trend to reduce dependence on overseas manufacturing and assembly began — so much so, that in the third quarter of this year China recorded the first net outflow of foreign direct investment. While the Americans led the West in blaming China for problems of her own creation, China experienced the folly of economic dependence on the export trade to America and her western military alliance. It was an issue which her thirteenth and fourteenth five-year plans had addressed, with China seeking to reduce her economic dependence on exports to the West. And when President Trump waged his trade and technology war against China, China responded by increasing her ties with Russia and together they have carved out a sphere of influence which encompasses most of Asia and Eastern Europe, spreading to China’s commercial links in Africa and Latin America where she now has substantial commercial interests. By pursuing a trade war against China, America had furthered an alliance between two geopolitical adversaries. The blowback from US trade policy has compromised her influence over more than 60% of the world by population. The repeated failures over America’s military and trade policies also became a major motivation behind the US’s provocation of Russia over Ukraine in the Orange Revolution of 2004—2014. Yet again, America made the mistake of responding by implementing trade and payment sanctions against Russia. The global 60% watched, not taking sides but had sufficient grasp of diplomatic chess to realise that the Americans were losing the Great Game. And the China/Russia partnership, with Iran and Saudi Arabia now in tow became increasingly determined to do away with the dollar as a trade settlement currency. Far from learning from Trump’s follies in fighting a trade war, President Biden’s administration continues with it, admittedly less aggressively. Trump and his trade advisers wrongly believed that they could bring China to heel over trade. But as will be seen from this article, the US trade deficit with China and elsewhere is a problem of her own making — it is the twin of the US Government’s budget deficit. Twin deficit theory posits that the trade deficit will rise with the budget deficit unless the American people increase their savings at the expense of immediate consumption. But it is more likely that hard-pressed American families entering an economic recession will continue to draw down on their meagre savings, which is likely to add to the trade deficit instead. America is a latter-day Don Quixote tilting at trade windmills. This article’s topic is to explain why this is so, and the implications for the US economy and the dollar. The national accounting identityFor some time, economists have assumed that all else being equal the relationship between the twin deficits is governed by the following national accounting identity: Trade Deficit @ Budget Deficit — (Savings—Capital Investment). Therefore, according to the equation the budget deficit must be covered by an increase of consumers’ savings in excess of capital investment, otherwise a deficit on the balance of trade will be the result. And if the level of net savings remains unchanged, the budget deficit should approximate to the trade deficit. The equation needs confirming by tracing payment flows. Initially, we must agree that whether it is created by the banks or the central bank, an excess of credit not originating from net savings is inflationary A major source of this inflationary credit is the budget deficit. Meanwhile, domestic production of goods and services is initially insufficient to respond to the extra spending in consumers’ hands. The supply gap created by excess credit injected into the economy as the consequence of a budget deficit can only be covered by higher unit prices and increased imports. Assuming a lag in the increase of production costs, domestic businesses can respond by increasing their output capacity, investing in intermediate goods and raw materials imported from abroad. This is why capital investment is a necessary component in the equation above. With diversified supply chains, over recent decades capital investment has bolstered production abroad, rather than domestically. This has reduced cost pressures on production, indicating that a rising trade deficit provides an important relief valve for inflationary pressures. That is assuming a stable currency exchange rate, which has uniquely benefited the dollar because of its reserve status and demand for it for funding and settling expanding international trade. Taken at face value and given that American citizens are unlikely to increase their savings in the current difficult economic climate, the trade deficit for the current fiscal year is set to increase in line with the budget deficit. Corrected for the creative accounting over student loan forgiveness, which was rejected by the Supreme Court, the budget deficit for the last fiscal year was about $2 trillion, of which 48% was debt interest. In the current fiscal year, the run up to a presidential election is bound to see a greater emphasis on deficit spending, and with the US economy stagnating or worse a spending deficit rising to over $1.5 trillion is likely with debt interest additionally taking the total to about $3 trillion. The twin deficit hypothesis suggests that the deficit on the balance of trade will trend towards a similar figure to the budget deficit. And this is despite US businesses rationalising their global supply chains, presumably seeking to bring them at least partially back to US soil and reducing their exposure to China. But before we look at the implications, we should look at the evidence, as to whether the twin deficit hypothesis holds up in practice. The chart below plots the twin deficits, with savings added to the budget deficit in accordance with the theory behind twin deficits.
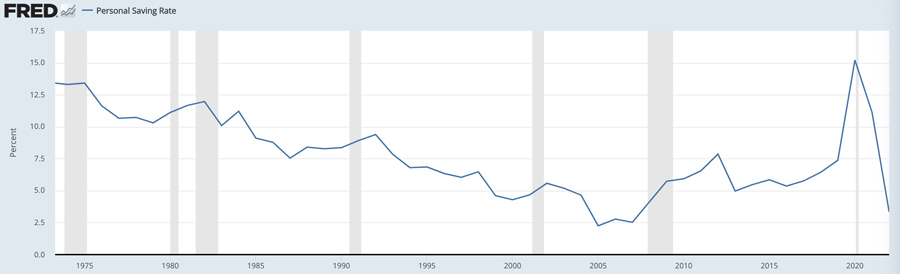
It will be noted that until 2019 there was a common trend, though the correlation was not tight. This could have been down to a number of factors, such as the Lehman crisis leading to a sharply increased budget deficit in 2009‑2010. The Covid shutdown in 2020 also dramatically increased the budget deficit, while supply chain failures severely restricted imports. At that time savings surged. Savings are a derived figure, being the difference between national income and recorded consumption, two figures likely to be unreliable. Income is not always reported, and consumption is generally confined to GDP items, which are new goods and services excluding second hand items. This became particularly relevant during and in the wake of covid lockdowns, when second hand capital goods, such as motor vehicles became substitutes for their new equivalents which were simply unavailable. There is a further issue which has become acute since the US Government’s borrowing costs have soared, and that is debt interest which is paid to into the financial system and excluded from GDP. For this reason, using deficits as a proportion of GDP in the calculation is an error. Timing is an issue as well, a probable lag between changes in the budget deficit and the trade deficit. A Cantillon delay effect is always a factor, though there is no knowing how long it takes for credit dilution to be fully reflected in higher prices. But we can be sure that when the budget deficit increases, the trade deficit will follow the trend of the former instead of coinciding with it. There has been criticism of the theory behind twin deficits from respected economists. For example, Kim and Roubini (2008)[i] concluded the opposite, that twin divergence is the norm in the US with a cut in the budget deficit raising the trade deficit. But instead of directly linking the two deficits, it makes more sense to accept there are other factors at work, such as timing, the pure subjectivity of prices, and changes between the trade deficit and the balance of payments. Accordingly, their approach fails to disprove the basic twin deficit proposition. After all, it is a hypothesis which transcends statistical modelling, assumptions between nominal and real GDP (which are increasingly distorted by interest payments being excluded from GDP), and the application of vector auto-regression modelling. You can prove anything with these incomplete statistics but the truth. The chart above clearly illustrates a common trend for these deficits and with some highly subjective statistics behind them the correlation was never going to be demonstrably close. Furthermore, the better approach by far is to understand the role of credit (which few respected economists do) and to trace its origins and deployment, which is the approach this article takes. It is on that basis that the twin deficit concept provides a starting point for understanding the economic consequences of a substantial budget deficit. Indeed, the difference between the two deficits over 20 years of government statistics and the Treasury’s creative accounting was $523bn, or a 28% increase in the total budget deficit over the total trade deficit. This is not a tight correlation, but taking into account the statistical factors outlined above it is sufficient to support the hypothesis. The role of savings The consequence of a budget deficit not funded out of savings is credit debasement. If the budget deficit is funded out of savings, it is at the expense of capital investment for private sector production. And if the budget deficit is funded by enhanced savings, consumer spending is accordingly subdued and price inflation moderates. This effect is particularly noticeable in savings-driven economies, such as China and Japan, where consumer price inflation is considerably less than in consumption-driven economies. Furthermore, according to twin deficit theory, if they are great enough savings can turn a budget deficit into a trade surplus — again, the examples of Japan and China prove this point. This is far from the case in America. The chart below shows the St Louis FRED’s estimate of the average annual savings rate, which has recently declined to 3.3%.
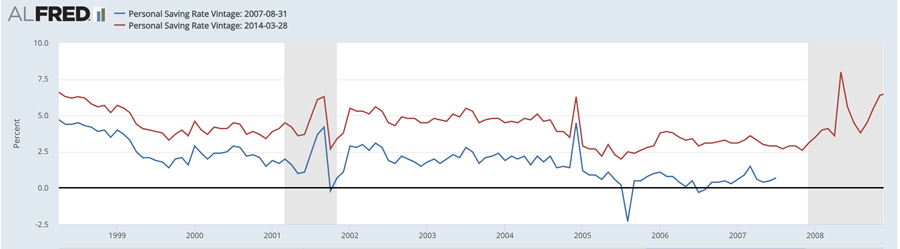
However, these estimates have been revised over time with the effect of concealing times when the savings rate went negative. The following chart shows how the savings rate went sharply negative in 2005 before the series was revised in 2014.
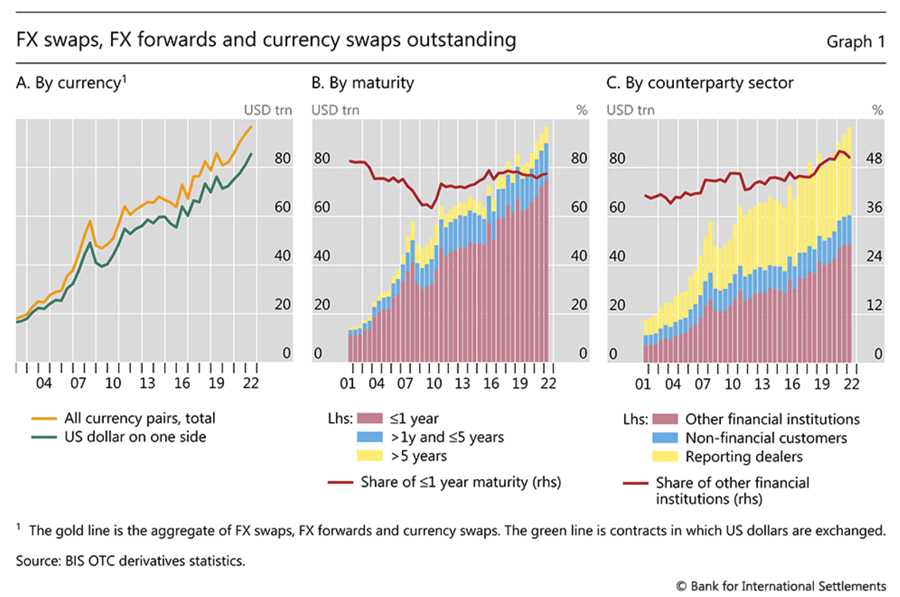
Going negative reflects a drawing down on consumer credit, such as overdraft facilities, credit cards, and car loans. If the statisticians at the Bureau of Economic Analysis had not revised their statistical method, arguably the savings rate today would be shown not to be 3.3%, but close to zero which accords with evidence from credit markets. And given that official statistics excludes considerable expenditures from GDP, which is intended to only capture consumer purchases of new goods and services, the true savings rate is almost certainly substantially negative. This is particularly relevant, given that savings are the principal offset between the two deficits. We can probably disregard further capital investment as an extra factor because bank credit is contracting, banks are de-risking their balance sheets, and the US economy adjusted for extra unproductive government spending is probably in recession. Therefore, the evidence strongly suggests that the US trade deficit will increase substantially during the current fiscal year to end-September 2024. The consequence for prices The pressures on the US’s trade deficit from a soaring budget deficit are likely to lead to increasing restrictions on trade. At a time when increasing interest rates and contracting bank credit are certain to lead to a deepening recession and rising business bankruptcies, the temptation for politicians to blame foreign agents will be too tempting. Just as President Hoover signed the Smoot-Hawley Tariff Act into law in 1930 when the US economy was imploding, it would be surprising if that folly is not repeated in 2024 under similar conditions. And it won’t be directed at China alone. All the indications are that the US economy has entered an autarkic period, probably becoming even more acute if President Trump succeeds in becoming the next US President. Clearly, such a move would make the average price for goods more expensive for the American people. But this is not to reckon without changes in the purchasing power of the dollar. One can speculate that by isolating America from international trade, a surplus of dollars held in foreign hands would overhang the foreign exchanges: according to the US Treasury’s own international capital system, foreigners own $33 trillion of short and long-term marketable securities and deposits, to which must be added dollar balances held in non-US banks, estimated by the Bank for International Settlements to be a further $85 trillion, with an extra $10 trillion in eurobonds. That’s dollar denominated credit totalling nearly $130 trillion, or over 4.5 times US GDP. In a panic, unwinding this colossal mountain of dollar credit has the potential to destroy the dollar completely, and a panic triggered by the withdrawal of America from international trade at a time of global economic recession cannot be dismissed. Obviously, such a panic would be reflected in soaring prices for goods priced in dollars. But even without that panic, there is likely to be a price impact if the US Government manages to severely restrict imports at a time of significantly increasing budget deficits. To assess the impact, let us assume that international trade to and from the US ceases entirely, and that the relationship between the twin deficits is thereby suppressed. Under these circumstances, the budget deficit, likely to amount to approximately $3 trillion, will lead to an increase in the quantity of dollars in M2 money supply of about 14%. Monetarists would argue that in time this increase will lead to the general level of prices rising a similar amount. But that does not account for the shortage of imported goods, or goods subject to punitive tariffs, which even without any subjectivity in prices could drive the rate of consumer price inflation significantly higher. So, this assumes no subjectivity in prices on the part of consumers. It is likely that faced with a new round of price inflation, consumers will begin to buy goods before prices rise even further. Savings would be increasingly raided, and consumer credit channels drawn upon, driving the savings rate even more negative (this is almost certainly the case already). Inevitably, interest rates would rise, commercial banks would limit their liabilities as their borrowers default on their obligations, and the debt trap in which the US Government is already ensnared would completely destroy government finances. We can therefore conclude that suppressing the twin deficit phenomenon even partly through trade barriers to protect domestic production would have the inevitable consequence of accelerating price inflation and collapsing the domestic purchasing power of the dollar. Almost certainly, foreign holders of dollar credit will anticipate these developments by selling dollars and liquidating dollar investments. The balance of payments and dollar credit exposure Following the Second World War, the dollar has been sustained by being the international trade currency. Indeed, since the 1950s, non-US banks have been creating dollar credit outside the US banking system, originally as a means of benefitting from Regulation Q which restricted the rates of interest US banks could pay depositors. The creation of offshore dollar credit accelerated following the suspension of Bretton Woods in 1971. As noted above, the quantities of onshore and offshore (eurodollar) dollars have grown to be extremely large, estimates to be split $33 trillion onshore, $85 trillion offshore, and a further $10 trillion in eurobonds. The view currently taken by international markets is that holding these balances has become the default position, and that holding other currencies and bank balances denominated in them represents relative risk. This has encouraged America’s trade partners to retain dollar payments, filling the gap between the balance of trade and the balance of payments. But it will be observed that total dollar credit in existence is substantially greater than the accumulated gap between these balances. This is partly due to international traders wishing to hold currency reserves, and others having investment exposure to dollar denominated financial assets. But by far the largest element is speculative bank balances and positions taken by non-banks. And it is these that are reflected in the dollar accounts of non-US banks. The $85 trillion figure above was the position in mid-2022, informing an article published by the Bank for International Settlements (Claudio Borio et al)[ii]. It represents foreign exchange commitments of non-us banks and non-banks, illustrated by the green line in the first graph below, of swaps and forwards commitments with dollars on one side.
Since then, it is likely that this total has continued to grow, reflecting an accumulation of FX swaps out of the yen and euros into dollars, suggested in the dollar’s trade weighted index rising strongly since the BIS’s triennial derivatives survey upon which Borio’s estimates are based. Being derivatives, most of these credit obligations are off-balance sheet, but nonetheless are still liabilities for their full amounts. The middle chart shows their maturities, nearly 80% of which are of a year or less, and of those Borio’s text reveals an estimated 70% matured within a week and 30% matured overnight. Irrespective of maturities, it is only accounting conventions which allow these obligations to be booked on the basis of their net market values in the case of FX and currency swaps, while forward commitments are booked when settlement occurs. It is within these totals that global speculative flows occur, with hedge funds and other arbitrageurs swapping low interest rate currencies for higher interest paying currencies to exploit yield differentials. In other words, if for any reason there is a contraction of outstanding derivative contracts, such as would occur in a global recession, it would lead to the liquidation of dollar obligations in favour of foreign currencies, mostly euros and yen. Furthermore, as the BIS article points out, “The very short maturity of the typical FX swap/forward creates potential for liquidity squeezes.”[iii] Whatever their origin and application, dollars are credit whose value depends completely on the holders’ collective faith. For the dollar to retain its value relative to other currencies, the spread between its interest rates and those of the other G7 currencies must be maintained. That the decline in US Treasury bond yields in recent weeks has led to a decline in the dollar’s trade weighted index should be no surprise. And if they decline further, there is an enormous long-dollar position to be liquidated. Add in the Asian axis’s desire to do away with the dollar… Followers of the great geopolitical game will be familiar with the expansion of joint Chinese and Russian interests throughout Asia, spreading through a growing BRICS membership into Africa, Central, and South America. They have already secured Saudi Arabia as an outright ally, for which the western alliance with its anti-fossil fuel policies has itself to blame. Other members of the Gulf Cooperation Council are sitting on the fence, as are the majority of non-aligned nations, either because they fear US reprisals, or they are indebted in dollars. But their abandoning of the western alliance is only a matter of time, whose idea of economic cooperation is to give paltry aid handouts much of which lines political pockets, creating lasting public resentment. It compares unfavourably with the infrastructure building and commercial cooperation offered by China. Fence-sitting by non-aligned nations could change very soon. In January, Russia takes over the presidency of BRICS. So far, Russia has failed to get a gold-backed trade settlement currency on the BRICS agenda, with pushback from India and China. But we should assume that Russia will not abandon her trade currency objective. For now, there is a broad agreement between members to accept each other’s currencies, which can only be a stopgap. We can expect Russia, in whose hands these currencies are entirely worthless, to redouble her efforts to promote a gold-backed trade credit system. Furthermore, there are good arguments in favour of Russia putting the rouble onto a gold standard, which done properly would lead to a substantial decline in rouble interest rates while its purchasing power is maintained. All this is very bad news for the dollar. Conclusion While there has been much attention given to the US budget deficit in the last month, very little has been given to the likely trade deficit in this new fiscal year. This is a bad omission, because the evidence is that a budget deficit, before adjusting for variations in savings drives the trade deficit. This is known as the twin deficit hypothesis. Doubt has been thrown on this phenomenon by some economists recently, which is addressed in this article. Not only is the budget deficit leading the trade deficit higher, but with savings turning negative the pull exerted by the former on the latter is increasing. Furthermore, in the run up to the presidential election, the process of withdrawing manufacturing lines from abroad and promoting domestic US production with increasing subsidies and trade protection is likely to intensify. And if President Trump is re-elected, we can expect a move towards complete autarky. The extent to which the twin deficit phenomenon is suppressed by these moves will result in an accelerating rate of price inflation. Therefore, any attempt to suppress the comparative advantage of foreign trade to the American people will reduce the dollar’s purchasing power. And at a time when the world is falling into a deepening recession, foreign ownership of dollars will become increasingly surplus to requirements for the purposes of settling trade. The Bank for International Settlements estimated in mid-2022 that there were $85 trillion in outstanding dollar credits in FX and currency swaps and forwards. These credits must be added to the US Treasury’s TIC estimates of a further $33 trillion of onshore credits in the US financial system, as well as a further estimate of $10 trillion in eurobonds. With the dollar’s trade weighted index having rallied since mid-2022, the BIS estimates are almost certainly conservative for today. If, as seems very likely, US policy is to suppress imports, this $128 trillion mountain of dollar credit is bound to contract, potentially collapsing the dollar in short order. Either significantly higher interest rates or the Fed’s inflationary response, or a combination of both, will do for the rest [i] Kim, Soyoung, and Nouriel Roubini, 2008, “Twin Deficits or Twin Divergence? Fiscal Policy, Current Account, and Real Exchange Rate in the US,” Journal of International Economics 74, pp. 362-383. [ii] See https://www.bis.org/publ/qtrpdf/r_qt1709e.htm [iii] See Dollar debt in FX Swaps and Forwards: huge, missing, and growing. https://www.bis.org/publ/qtrpdf/r_qt2212h.htm
|
Send this article to a friend:
 |
 |
 |


![[Most Recent Quotes from www.kitco.com]](http://www.kitconet.com/images/live/s_gold.gif)
![[Most Recent USD from www.kitco.com]](http://www.weblinks247.com/indexes/idx24_usd_en_2.gif)
![[Most Recent Quotes from www.kitco.com]](http://www.kitconet.com/images/live/s_silv.gif)