Send this article to a friend:
September
07
2024
Send this article to a friend: September |
The Fed Is Our Friend - Gold Price Predictions
If the Payrolls are lower than expected, the probability of a 50bp rate cut will rise significantly. Typically, this is supportive of precious metals and miners. Such a rate cut would also represent a new cycle of rate cuts, otherwise known as a Fed pivot, and the first rate cut since March 2020.
However, if the Fed cuts rates by just 25bp, then the market will likely be disappointed and down go the metals and miners. GOLD CHART
In the meantime, Gold has broken down out of its bear flag, which was to be expected. Now the question is: How low could Gold go prior to the next rally? Using a simple ABC correction from the peak on Aug. 20, the targets on the downside are as follows:
I would expect $2500 or $2460 to be the bottom, then we head up to $2700 next. I’m leaning to $2460 for the bottom. SILVER CHART
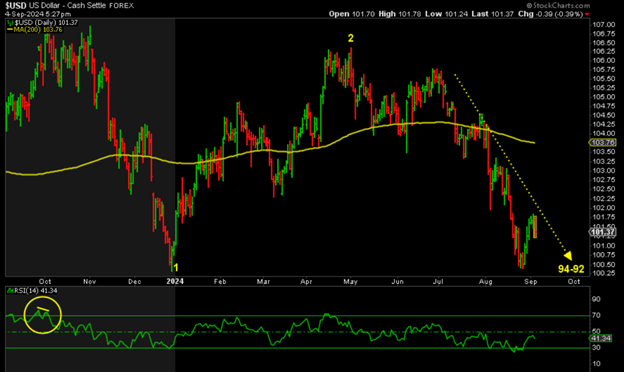
Silver is a little more complicated than Gold, as always. I will start with the worst-case scenario, a break below key support at $26.50. This would mean that wave 2 is not complete and we risk a drop to $26-$24, imho. This not only means a bigger drop than expected, it also delays the rally we have all been waiting for, wave (iii) of 3 of iii of (3), the money wave! By contrast, as long as we remain above $26.50, I am looking for a bottom in wave (ii) of 3 above there. The best-case scenario is that we have already bottomed at $28, based on a simple ABC correction: $28 also happens to be the 61.8% retracement of the rally from $26.50 to $30.55. It has also been tested twice and held. However, if $28 is broken, then any of the following levels could be the low, based on the rally from $21.98 to $32.75: Once Silver bottoms, and it may already have, I am expecting at least $31-$32 for the next peak, and possibly $33-$34 before the next reversal. DXY CHART  My primary target on the downside remains 94-92. In the meantime, I believe it could rebound to a peak somewhere between 102.50-103.00, then down it goes. Below 100 and it’s look out below, imho. The inverse correlation between DXY and precious metals has been re-established. “When” the DXY dumps towards 94-92, this supports higher highs ahead for the metals and miners and the wave 3 rally we have all been waiting for. Conclusion I am waiting for the peak in DXY and the lows in Gold and Silver to trigger a massive rally into year end and 2025. And the Fed, for once, is our friend. Note: In the case of a stock market crash, all bets are off. I expect a sharp but brief dump in metals and miners should that occur.
|
Send this article to a friend:
 |
 |
 |