
Send this article to a friend:
August
21
2023

|
Send this article to a friend: August |
|
Two Years to Bust
Few remember the timeline, however. Greenspan began raising rates from 1% in June 2004 to 5.3% by July 2006: two years of steady hikes. Then Bernanke kept the fed funds rate stable until August 2007, another year. Only then did the Fed start cutting as distress began to spread through the financial system, and it took another twelve months for the full panic to hit. A quick survey of financial history demonstrates that this sequence of two years of interest rate hikes, then bank stress within a year, then economic contraction prompting government action is a typical timeline. From the 1987 post-crash low in the fed funds rate of 5.7%, for example, it took nearly two years to reach 10%, at which point the Savings & Loan sector imploded. S&Ls represented a quarter of U.S. banking assets, three quarters of which were deployed as long-term mortgages to retail customers. This was before the development of secondary markets, so the S&Ls held mortgages to maturity and took the interest rate risk. When Volcker jacked up the fed funds rate, deposit rates followed, and S&Ls found themselves paying more to retain deposits than they were earning from legacy mortgages. The government should have shut them down, but in an effort to avoid the immediate costs such action would entail, Congress increased FDIC deposit insurance limit by two- and-a-half times and eroded Glass-Steagall to broaden the assets against which S&Ls could lend. The hope was that the insurance would convince depositors to leave their funds in place and that the S&Ls would be able to earn their way out of trouble. Banking executives embraced the classic agency risk of semi-solvent entities: management got a disproportionate share of the upside through their compensation packages while the government (by way of deposit insurance) owned the downside. It became rational to make crazy loans. After two years of Greenspan’s interest rate hikes, the banking crisis hit—not all at once, as in 2008, when the money-center banks teetered, but bank by bank. S&Ls typically held small, FDIC insured deposits, so private losses were limited. Nevertheless, more than eighteen hundred banks failed, a recession arrived in the third year after rate hikes began, and Greenspan lowered the fed funds rate dramatically, from 10% to 2.5%. The Nixon years saw two similar episodes. The Fed under William McChesney Martin began raising rates in late 1967 to contain inflation, from 3.75% to 10% in two years. Ten months later, the conglomerate Penn Central collapsed, the largest bankruptcy theretofore, ushering in a severe recession, and the Fed lowered rates right back down to 3.75%. Fed chairman Arthur Burns then went through the same exercise. After a false start in 1971, Burns raised the fed funds rate from 3.75% in February 1972 to 13% in July 1974. Franklin National Bank collapsed that October, the largest failure at that point in U.S. history. Recession hit, and Burns had the fed funds rate back at 5% within seven months, even as annual inflation was running at 10.2%. This pattern and the timing is persistent deeper into history. The Fed’s first effort at tightening financial conditions occurred during the bubble surrounding World War I “with the object,” according to the Fed, “of bringing about more moderation in the use of credits, which a year ago were being diverted into all kinds of speculative and non- essential channels.” The New York Fed raised rates from 3.75% in December 1917 to 7% by early 1920.3 Industrial production began to dive that August, along with the stock market and commodities prices (which were cut in half ).4 The Fed bought government bonds to alleviate financial conditions—they didn’t call it QE, but that is what it was. And then the big one, 1929: the Fed began to raise rates in February 1928 to constrain asset markets. Twenty months later, the stock market plunged, prompting the Fed to intervene massively and to slash its rate to 1%. While the storybook version of the era imagines that the Great Depression began overnight, the real crunch did not begin until the Austrian bank Creditanstalt failed in May 1931, just over three years following the Fed’s shift in policy. We can go even further back, into the era before central banks, yet the pattern does not change. The credit markets were not free even then, of course, since legal tender laws provided a government subsidy to banks, and the U.S. Treasury could and did interfere. In 1898, the Treasury Department began allowing government balances to accumulate in banks as reserves, which served as inflationary fuel. In 1903, following a brief slowdown, the Treasury Secretary announced that he would transfer balances from the Treasury to the banks to the extent needed to prevent any stringency in the money market. “No statement,” noted a contemporary economist, “could have made more explicit his notion that it was the function of the government treasury to guard and protect the money market, to keep interest rates down and to prevent credit contraction.” Nevertheless, the commercial paper rate increased from 3.5% in mid-1904 to 6.5% two years later.5 Fifteen months after that, Otto Heinze tried to corner the stock in the United Copper Company, failed, and brought down his funding banks. Panic quickly spread to the whole banking system. The ensuing market crash was so severe that banks demanded the creation of a central bank to protect them in future crises. The previous panic of note (skipping over the panics of 1896, 1893, and 1884) was the panic of 1873, which triggered the first “Great Depression,” later known as the “Long Depression.” The federal government had been forced to issue “greenbacks,” fiat currency, to fund the Civil War because its credit was so bad that the banks would not advance loans. Greenbacks circulated because Congress had made them legal tender for all debts, public and private. The depreciation of greenbacks was, therefore, not observed as a fall in their nominal price against goods (and especially gold), but, since prices were pegged to greenbacks, depreciation manifested as soaring prices. A contemporary described the side-effect: “Flushed with greenbacks, and influenced by the varying fortunes of our armies, the whole population of the North gave itself up to a speculative frenzy. Brokers were overwhelmed with orders. The slang of the stockboard found its way to the drawing-room. Everybody made ventures.” Think housing bubble or crypto madness. After war passions and expenditures cooled, the government determined to return to gold-backed money. In his inaugural address, President Grant declared: “Among the evils growing out of the rebellion and not yet referred to, is that of an irredeemable currency. . . . It is a duty, and one of the highest duties, of government to secure to the citizen a medium of exchange of fixed, unvarying value. This implies a return to a specie basis, and no substitute for it can be devised.” However, Grant recognized that retiring the greenbacks suddenly would bring immediate deflation and “would compel the debtor class to pay, beyond their contracts, the premium on gold at the date of their purchase, and would bring bankruptcy and ruin to thousands.” The solution, Grant advised, was not to contract the excess supply of paper money by retiring the greenbacks but hold the supply of currency constant until the natural economic growth of the country grew into the existing supply and to substitute gradually fiat greenbacks with gold-backed currency. His error was a precursor to the fundamental problem with monetarism and Keynesianism: inflation does not increase prices uniformly throughout the economy, and even the Cantillon Effect (which describes how those who get newly emitted money first are enriched at the expense of those who get it last) is not the greatest evil. Newly emitted money suppresses interest rates, which encourages speculation especially in capital-intense businesses, the focal point in this era being railroads. Holding the money supply constant would necessarily raise rates as businesses funded with artificially low rates scrambled for capital to survive falling prices due to overcapacity. From July 1871 to April 1873, the commercial paper rate for New York increased from 4.9% to 11.4%.6 Rates always jumped in the autumn as farmers withdrew cash from banks to pay farmhands at harvest; in September 1873, after a summer respite in rates, the commercial paper rate soared to 14.3% and to 16.5% the following month. The September 1 edition of the New York Herald urged calm: True, some great event may prick the commercial bubble of the hour, and create convulsions; but while the Secretary of the Treasury plays the role of banker for the entire United States it is difficult to conceive of any condition of circumstances which he cannot control. Power has been centralized in him to an extent not enjoyed by the Governor of the Bank of England. He . . . [has] a greater influence than is possessed by all the banking institutions of New York. A week later the New York Warehouse & Security Company declared itself illiquid but solvent. The president of the company announced that the suspension of operations was only temporary: “This company has loaned money and its notes to railways and construction companies . . . some of whom are not able to respond. For the money and paper loaned, the company has what its managers consider ample security in the shape of collateral and endorsements.” This was the same complaint as the banks made in 2008: we are illiquid but solvent. In neither case was this true without government intervention. As in 2008, the Grant administration sprang to action. The act of 1864 issuing a maximum of $400 million of greenbacks had never been repealed, and since the outstanding issuance had fallen below that figure as greenbacks had been replaced with Treasury gold notes, Treasury Secretary George Boutwell reasoned he was authorized to issue more. He flooded the market with a sudden issuance of $29 million greenbacks, and Grant declared them to be the best currency “that has ever been devised.” Congress passed a bill to increase the supply of currency officially, but a public outcry forced Grant to veto the measure. A. Barton Hepburn, president of Chase National Bank, who recorded the episode in his masterful A History of Currency in the United States, concluded: “The history of this decade is but a repetition of the experience of every nation with fiat money. The first step taken, the rest follows easily—inflation, delusion of the people, breach of faith, disaster.” Various elements from the episodes listed above form a nice composite of our current circumstances. As prior to the Panic of 1873, the government spiked the money supply (not to fight a war but in battle against a virus, the lethality of which was confined largely to the geriatric population), with the Fed’s balance sheet expanding by $4.7 trillion.7 Brokers were overwhelmed with orders; speculative markets boomed; consumer price inflation soared. However, beginning in March of 2020, the Treasury ran its account at the Fed from $400 billion to $1.8 trillion.8 The effects of money held at the Fed is different than money held at the banks, where it acts as reserves that allow banks to make loans (and our fractional reserve system means banks can lend out a multiple of reserves). Money at the Fed cannot expand credit. It would be as if the Treasury Department printed up $1.8 trillion in currency and hid it in the basement—as long as the currency stays there it would have no influence on prices. Various stimulus programs forced the Treasury to begin spending that money into the economy in February 2021, with the Treasury account balance falling by $1.7 trillion by October. But, to offset Treasury spending, in March 2021 the Fed began offering competitive rates in its reverse repo facility. Money market funds and other financial institutions use this facility to park cash, which (similar to Treasury cash) is thereby withdrawn from the banking system. The only difference with Treasury cash is that the Fed must offer an interest rate incentive to keep the money locked up, creating large operational losses for the Fed. From March 2021 to September 2022, the Fed’s reverse repo facility soared from $200 billion to $2.6 trillion: more than half of COVID’s QE was thereby sterilized.9 During the recent debt ceiling impasse, the Treasury ran its cash balance at the Fed down to $48 billion in May. But then the Treasury balance spiked to $550 billion by July. Some market commentators expected asset markets to crumble as $500 billion was suddenly sucked out of the system; they failed to notice that the Fed had allowed the interest rate on its reverse repo facility to become less competitive, and the facility’s balance declined by $600 billion during the same time, meaning a net $100 billion was pumped into the financial system. No wonder the financial markets shrugged off the increase in the Treasury balance. These offsets are not random. They are a crude attempt to do what Grant was trying to in the 1870s and the Treasury in the 1900s: move money around to prevent stringency in the money markets while keeping the overall quantity of money stable. The chart below shows the Fed’s balance sheet and also the balance sheet net of Treasury cash and reverse repo balances. The first observation is that the Fed’s adjusted balance sheet is 38% higher than the peak in 2015, as opposed to 84% for the non-adjusted figure. The second is that while Quantitative Tightening began in April 2022, the adjusted size of the Fed’s balance sheet is unchanged since June 2022.
As in 1873, however, managing the money supply cannot unwind the speculative mania that the Fed’s credit policy unleashed. To do that requires interest rate increases, and the Fed, which as late as February 2022 was worrying about deflation, began to tighten suddenly in March of 2022, seventeen months ago. We are still within the typical twenty-four month period within which few financial accidents occur (though the sheer magnitude of the debt and rapidity of the interest rate increases argue for an accelerated timeline). We may speculate as to why this period exists—most likely because of the term structure of debt, the fact that even the most reckless institutions have some equity or at least cash to burn through, and because, bizarrely, the national interest rate on checking accounts remains 0.07% and on savings accounts 0.42%, meaning banks are still making a margin even on fixed-rate legacy loans made at rates far below the current market.10 Online savings accounts, available to retail customers with a few mouse clicks, are currently offering over 4.3% interest. Corporate CFOs can roll short-term Treasuries at 5.5%. It is not credible that the banking industry will be able to retain such a low cost of capital for long. As the cost of capital rises, the banking industry will face the same challenges as the S&Ls did in the 1980s. In that episode, Congress raised the FDIC limit; this time the Fed has implemented the Bank Term Funding Program under which banks can borrow 100% of the face value of U.S. Treasuries, agency debt, and mortgage-backed securities even though interest rate hikes have made their market value fall materially.11 The purpose is the same: to convince depositors to leave their funds at regional banks. The policy goal, as in the 1980s, is the hope that the banks will be able to earn their way out of insolvency. It didn’t work then It has since drifted up to $107 billion: and it won’t work now for the same reason it failed in 1873: the country cannot “grow” into malinvestments. They must liquidate. The initial liquidation is generally the spectacular collapsed of a highly levered, interconnected financial institution: the New York Warehouse & Security Company, Otto Heinze and his bank, Penn Central, Franklin National, Lehman, etc. The S&L debacle is an exception, though in that case the government took the loss. In periods of globalization, the collapse of a non-U.S. institution can be the trigger, such as Creditanstalt, and it is possible that the collapse of the absurdly levered Chinese banking system could play that role today. Commodities collapse; markets tank. In the fiat world, the short squeeze of paper currency also sends gold reeling, though less than other asset classes. History tells us what will happen when the accident occurs: the Fed will print, and markets will soar, especially gold and the miners. Powell has already fallen victim to the interest rate cycle. He began decreasing the Fed’s balance sheet in October 2017, and then financial conditions forced him to begin printing again in September 2019, exactly two years later. He also gave us a foretaste of Fed policy after the collapse of Silicon Valley Bank last March. After years of promising never again to sacrifice the national credit for a private institution, the Fed in two weeks unwound 38% of the previous year’s Quantitative Tightening. SVB would have been the first domino had the Fed not acted as it did. But government intervention can merely delay the liquidation of malinvestments and insolvent entities, and the delay allows the situation to get worse. Give it some time (though not much). There will be other, larger accidents, and the Fed will pivot. It always has. There is no choice other than a Great Depression-style collapse, only worse since debt burdens are much larger. The difference with past episodes is that military failures in Afghanistan and the Ukraine have put the U.S. in a much worse geopolitical position. And deficits are already exploding even before Keynesian automatic stabilizer spending kicks in and taxes dry up. Gold bull markets of the past four decades were driven by easy money, which also lifted stock markets; a panic out of the dollar would make those look tame, and stocks would go down not up. It is hard to imagine a better set up for gold or more enticing valuations for the gold miners.
|
Send this article to a friend:
 |
 |
 |
 Financial commentators marvel how the Fed has been able to increase the fed funds rate from 0% to 5.3% without a major financial accident (other than the failure of a few regional banks).
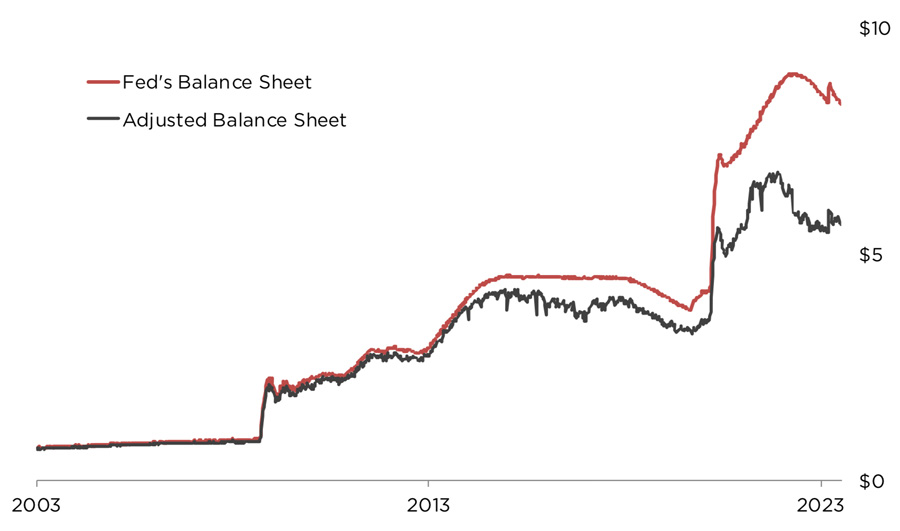

![[Most Recent Quotes from www.kitco.com]](http://www.kitconet.com/images/live/s_gold.gif)
![[Most Recent USD from www.kitco.com]](http://www.weblinks247.com/indexes/idx24_usd_en_2.gif)
![[Most Recent Quotes from www.kitco.com]](http://www.kitconet.com/images/live/s_silv.gif)