Send this article to a friend:
July
17
2024

|
Send this article to a friend: July |
|
The Housing Market Hit A Wall In May/June – It’s Headed South Pronto
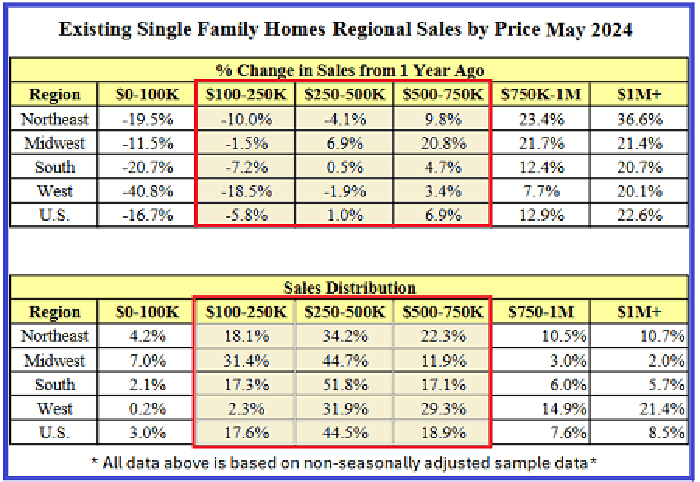
Housing market update – In taking a deeper dive into the existing home sales report for May, I noticed that the distribution of sales across the six price “buckets” shows a different story than the headline number broken out by sales region: The table below is from the Supplemental Data link on the National Association of Realtors news release. The data is the not seasonally adjusted, monthly data. On a monthly basis for May, the NAR data shows an estimated 364,000 homes (no change YoY) sold in May at a median price of $380,400 (half sold above that price and half below).
The headline numbers, however, are deceptive. Per the top table, the two highest price buckets showed double-digit increases in the number of homes sold YoY while the two lowest price buckets declined YoY. All of the action in the May sales was in the two highest price buckets while the everything below the top two buckets was flat to down. The data reflects the degree to which buying a home or moving up from a starter home has become unaffordable for the majority of households. In fact, Friday’s U of Michigan Consumer sentiment report (discussed below) showed that homebuying conditions in June hit a record low for the history of the data series. Given the recent reports based on Zillow data that many of the previously hottest housing markets are experiencing a huge influx of listings and big price cuts in the listings, in most areas the buyers in the top two price buckets will soon be underwater on their home purchase. Moreover, as the amount of listings piling up in the various MSAs becomes more “visual” to prospective buyers in the two top price buckets, many will hold off buying. The homebuilder stocks went straight up the last three days of the week, with most of the move triggered by better than expected, but highly rigged, CPI report.
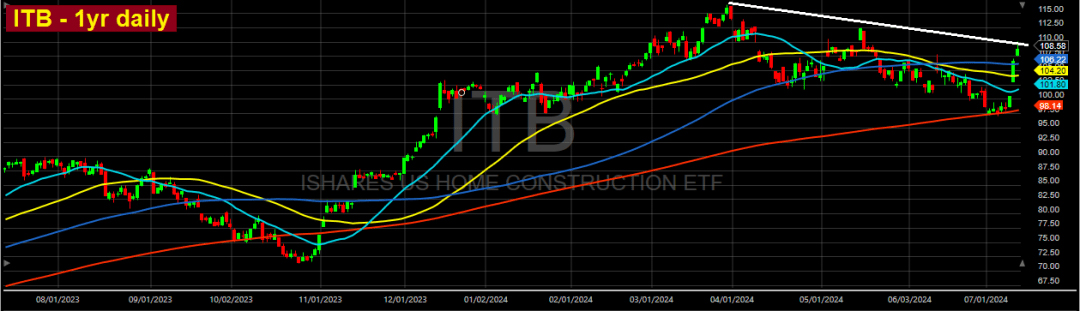
The ITB ETF was up over 6% and the individual homebuilders stocks were up anywhere from 6-12%. It’s my opinion based on my observations in around the metro-Denver area as well as from reports from around the country that the housing market likely hit a wall in May/June. A colleague and friend who lives in the north-metro part of Denver told me that the DHI salesman who sold him his home not that long ago has quit because he said it’s too slow to make a living. Per the chart above ITB, as a proxy for the homebuilders, shot straight up after it sold down to its 200 dma (red ma line) and tested it for five days. If the Government had reported inflation honestly, it likely would have done a cliff-dive below the 200 dma. I think the move in ITB in the latter part of the week was a combination of bubble-mania, hedge fund short-covering and technical-based momentum-chasing. I have to believe that the actual fundamentals of the housing market will invade the highly overvalued homebuilder stock sector within the next three to six months. The primary driver of the record low buying conditions is high home prices. I would argue with high conviction that, given the data on household financials, even if the Fed took rates down to zero percent it would not do much to jump-start the housing market. Before putting the cart before the horse on interest rate cuts, it should be noted that the CPI report this past week was a total sham. The BLS claims that food prices, which are a significant component of the CPI calculus, declined 0.1% in June from May. I did not experience that in the general basket of food items that I purchase every week. Also gasoline prices have begun to rise again after falling from late April to mid-June. In fact, the average price of gasoline has risen 9% since the beginning of June. Oil futures have jumped 13.2% over the same time period. The price of gas usually lags the directional move in futures. Furthermore, the PPI report came in hot at 0.2% higher from May vs 0% expected, while May was revised higher. YoY the PPI was 2.6% vs 2.3% expected. The “core” PPI for 0.4%, double the expectation. Worse, prices for intermediate demand goods (partially processed commodities that will be used as inputs to product final demand goods) is accelerating. With respect to rate cuts, the median new mortgage payment now requires 41.4% (pre-tax) of the median household income according to the data parsed by Reventure Consulting (median household income (Fed) divided by median new mortgage payment (Bankrate). In the previous housing bubble, this metric topped at 39.3%. This is why I believe it won’t change reality for housing market if the Fed eventually takes rates back to zero.
|
Send this article to a friend:
 |
 |
 |