Gold Prices Are Knocking On The Door Of New Record Highs
Jesse Felder
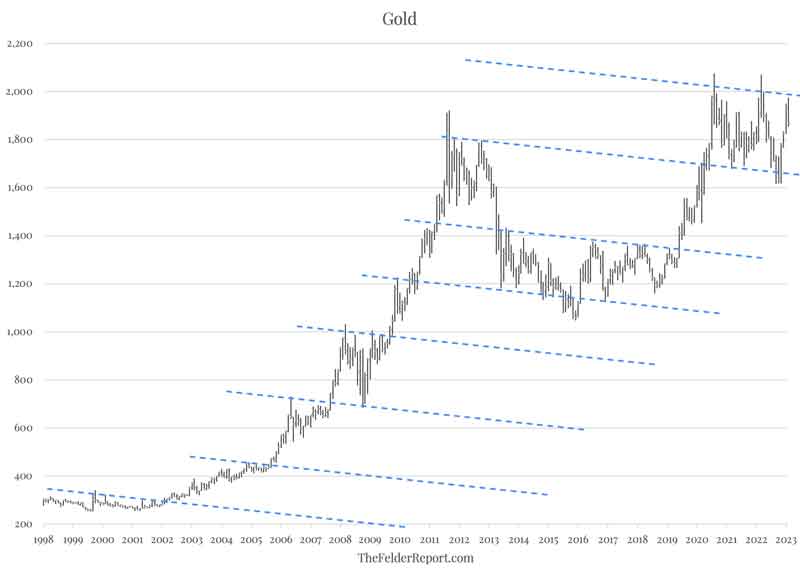
 When it comes to technical analysis I subscribe to the KISS philosophy: Keep It Simple, Stupid! The more complex it gets, the more the study of charts and price patterns loses its usefulness, in my opinion. In this vein, I’ve noticed a very simple stair-step pattern in the trend of gold prices over the past 25 years or so. Prices move higher until they reach a ceiling, denoted by a descending trend line, at which point they consolidate for a time. During bull phases, like that seen from 2002 to 2011, these consolidation periods don’t sustainably violate the prior trend line; during bear phases they do. Interestingly, these trend lines have created a series of parallel lines that can help to identify support and resistance areas for future consolidation ranges. When it comes to technical analysis I subscribe to the KISS philosophy: Keep It Simple, Stupid! The more complex it gets, the more the study of charts and price patterns loses its usefulness, in my opinion. In this vein, I’ve noticed a very simple stair-step pattern in the trend of gold prices over the past 25 years or so. Prices move higher until they reach a ceiling, denoted by a descending trend line, at which point they consolidate for a time. During bull phases, like that seen from 2002 to 2011, these consolidation periods don’t sustainably violate the prior trend line; during bear phases they do. Interestingly, these trend lines have created a series of parallel lines that can help to identify support and resistance areas for future consolidation ranges.

The action in gold prices over the past couple of years or so has formed yet another consolidation range. The support for this range dates back to the bull market peak put in just over a decade ago. Adding another parallel trend line above the peaks over the past couple of years give us technical resistance, which was tested again last month just before gold prices recently reversed lower. If the bull phase that began in 2016 is to continue, gold prices will breakout and push to new, record highs. Conversely, a sustainable breakdown below the recent lows would signify a new bear phase has begun. And this is where other indicators and disciplines come in handy. Because the longer inflation remains elevated and the Fed remains behind the curve, the greater the chance of a breakout versus a breakdown.

Jesse began his professional career at Bear, Stearns & Co. and later co-founded a multi-billion-dollar hedge fund firm headquartered in Santa Monica, California. Since founding Felder Investment Research, LLC, publisher of The Felder Report, his writing and research has been featured in major publications and websites like The Wall Street Journal, Barron's, Yahoo!Finance, Business Insider, Investing.com and more. Jesse also hosts and produces the Superinvestors and the Art of Worldly Wisdom podcast.
thefelderreport.com
|


