January
8
2013
8
2013
|
January 8 2013 |
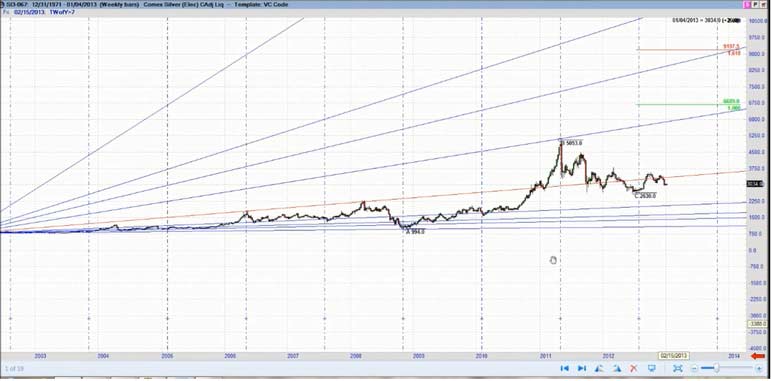
Silver Forecast Is $90 In 2013? 
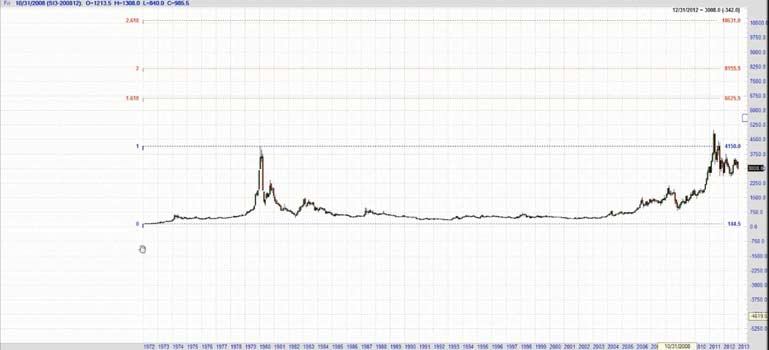
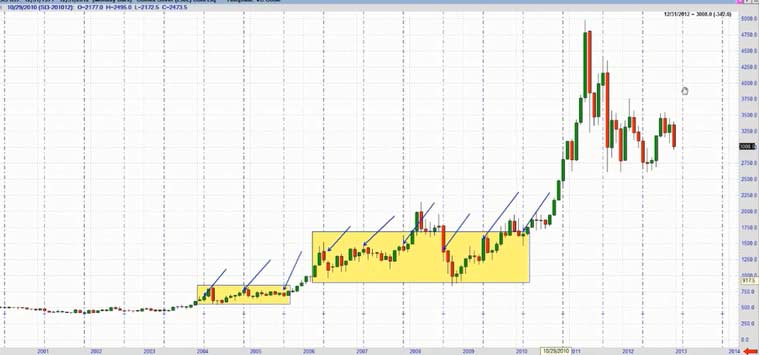
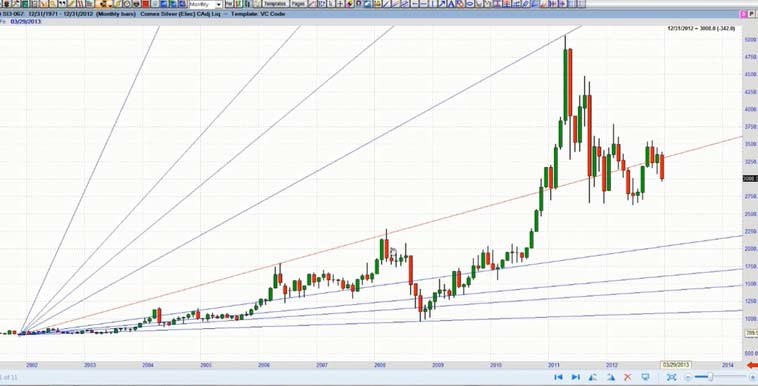
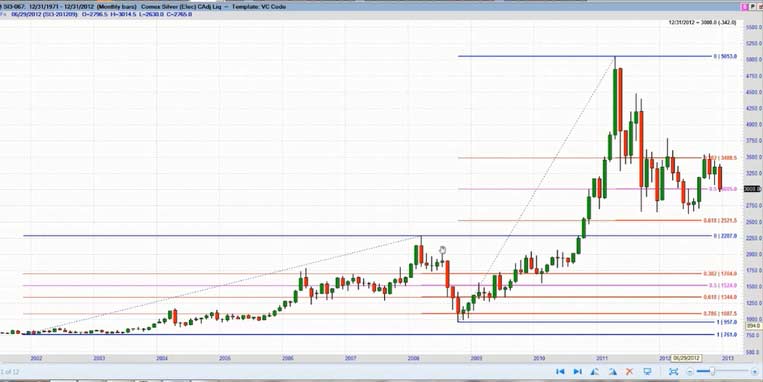
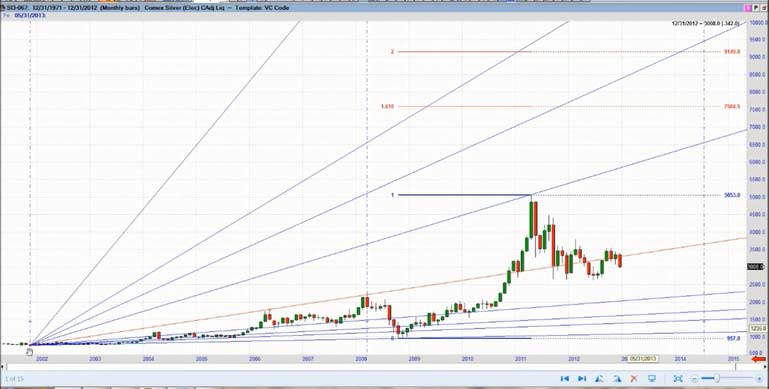
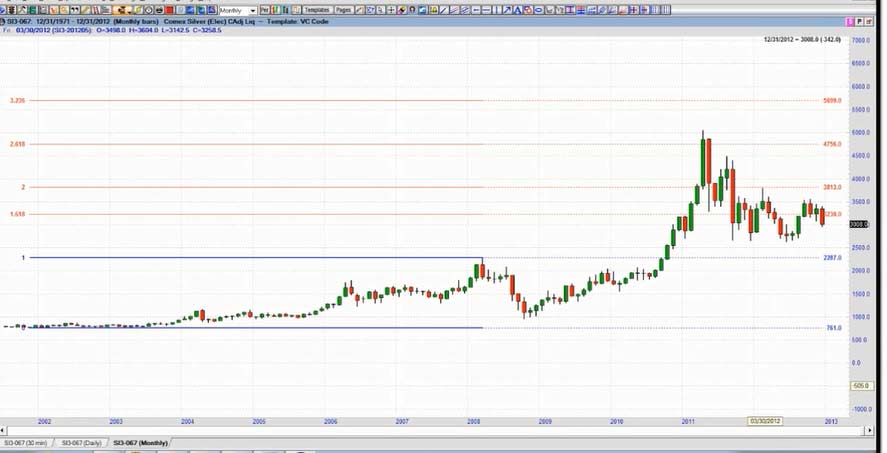
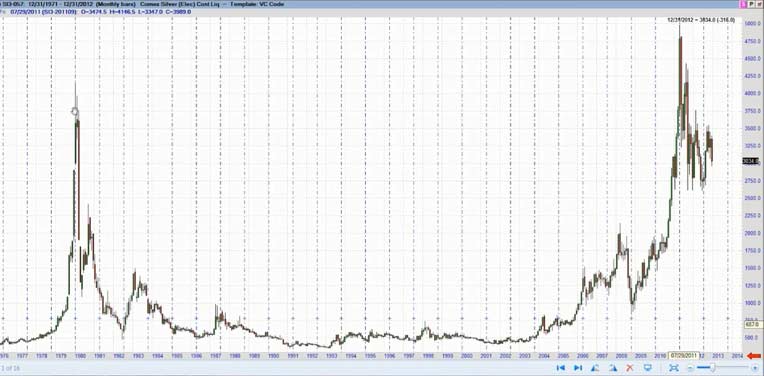
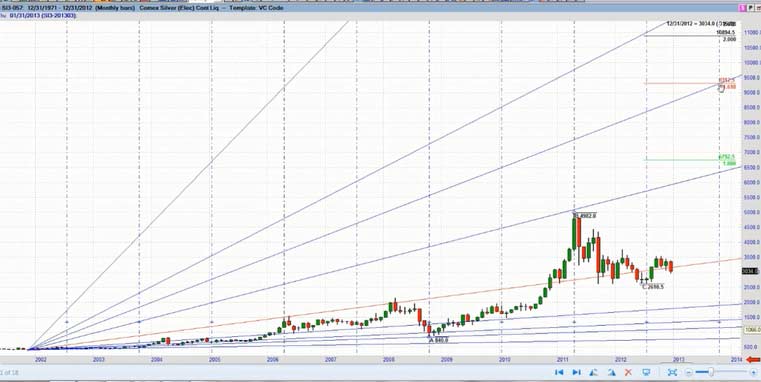
The minutes of the Federal Open Market Committee's December meeting "sucked all of the oxygen out of the room for gold bulls - and if not for the reversal in silver, I believe the sell-off in gold would be more pronounced," said Steve Roy, Chief Technical Analyst for Equity Management Academy. Gold's weakness was set off by Thursday's release of the minutes from the Fed's last meeting, which showed that several Fed officials thought the central bank would be able to slow or stop its bond purchases - a method of increasing monetary stimulus that goes beyond low interest rates - well before December 2013. Silver's slip Friday made its value at its cheapest compared to gold since late August, with 55.76 ounces of silver now equal to one ounce of gold, against 50.4 in early December. Gold's price falls may be due to profit taking by speculative players. Since December 20th, gold had risen from $1,638/oz to $1,694/oz or by 3.5%. It may also be the case that bullion banks with large concentrated short positions are using the pretext of the Federal Reserve minutes to manipulate the price lower - both to profit and to allow them to close out their significant short positions at more advantageous prices and possibly even go long. "Fed trying to suck and blow at the same time. This was an effort to bomb real assets. It will fail ," commented Eric Sprott from Sprott Asset Management on a phone interview. For the first time since the financial crisis started five years ago, the Federal Reserve has at last made its first signal that its extraordinary loose monetary policy will start to get tougher. But, the minutes show, the central bank is starting to say, enough is enough. Of the crowd that supported bond buys, a few say they should continue until the end of the year, and several said it could stop, or slow, well before then. Without any specific strategy or defined plan to replace Operation T wist moving forward and beyond the 2013 deadline, it seems very clear that the door is wide open to introduce QE4. What form it will take is anybody's guess. This will come on the face of a deeper problem as they try to negotiate the next round of the Budget Deficit ceiling and the U.S. Debt Crisis. In 2008, publicly held debt as a percentage of the economy ( GDP ) was 40.5 percent, nearly four points below the post-World War II average. Since then, the debt has increased by 45 percent. The President's FY 2013 budget would increase the debt to 76.5 percent by 2022, despite $2 trillion in tax hikes. In recent decades, Japanese governments have piled up debts worth some ???11 trillion ($14.6 trillion). This corresponds to 230 percent of annual gross domestic product, a debt level that is far higher than Greece's 165 percent. Domestic banks and insurers have purchased 95 percent of the country's sovereign debt using the savings deposits of the general population. Experts warn that this system cannot go on for much longer. Takatoshi Ito, an economics professor at the University of Tokyo, have calculated that even if the Japanese people invested all of their assets in sovereign bonds, it would only be enough to cover 12 years of state expenditures. One additional "potential risk," is the "amount of holdings of Japanese government bonds within the banking sector," as central bank chief Shirakawa politely notes. If long-term interest rates were to rise considerably, it could affect the stability of the sector. That, at the very latest, would mark the point at which the crisis could spill across Japan's borders. In Germany, financial institutions like Mitsubishi UFJ may not be widely known, but they are still internationally networked mega-institutions that have the potential to destabilize the entire finance community. As the publicly held debt grows , net interest payments will increase dramatically, even assuming that interest rates remain low. Under current projections, real net interest costs would more than double over the next decade. Conclusion It is very unlikely that current central leaders will make any long-term fundamental changes to reduce the risk currently transferred to the world bond markets by the reckless spending and printing of fiat currency. As history shows at least in the last 300 years, it does not work. As the sentiment and perception of wealth becomes more pronounced with the realization and loss of its currency purchasing power, inflation or even hyperinflation becomes a very real threat. Currently, this threat is greater due to the fact we are in a global economy. If we sneeze China gets a cold. With this historic potential for precious metals staring us in the face and the long-term secular bull market intact, I spoke at length with Steve Roy, Chief Technical Analyst for Equity Management Academy and discussed the profit potential for the silver market for 2013 and beyond. According to Steve Roy, where the focus is managing wealth, through education. This is his forecast for Silver prices for 2013 and beyond. This analysis uses proprietary indicators, Fibonacci cycles, W.D.Gann analysis, as well as wave analysis (not necessarily that of Elliott). First, we are looking at a monthly continuation chart going back to 1971. I have used the Fibonacci expansion tool using a low in 1971 to the high in 1980. The 1.618% expansion of that move is $66.26, the 200% expansion is $81.56, and the 2.618% expansion is $106.31. I will base the rest of this analysis from the low in November, 2001 at $7.61, here. In order to get a better look, I have added a 9 month cycle from the 2001 low, and it ends in February of 2013, and again in November. Notice how, for the most part, this cycle shows highs to highs, except when the market corrected or consolidated. In this chart, I have included the Gann fan connecting the first two major tops of the move off of the 2001 low. Isn't it amazing that the high in 2011 hit the 2x1 line and sold off? This is alerting ME to accelerating movement in the up trending move. Now, we see the Fibonacci retracements of the impulse waves 1 & 3. The chart is a little messy, but I will clarify it now. Wave 1 was from Nov 2001 low, to the high in March of 2008. We then had an ABC correction down to the Fibonacci 78.6% retracement; a perfect Gartley pattern (wave 2). The ensuing impulse wave 3, terminated in April of 2011, and we have been in a wave 4 correction until June of 2012. I'll explain why in a few minutes. I have now added a Fibonacci expansion to Wave 1. Notice how the 2.618 expansion nailed the top of Wave 3. In this chart, I have added the Fibonacci expansion to Wave 3. The 2.618 expansion is at $116.81. The 2.000 expansion is at $91.49. The 1.618 expansion is at $75.85. Now, we have some price targets for the upcoming wave 5 of the move. Let's see when this move might happen. We are now looking at the move from November 2001 with the Gann fan, and I have added the 76 month cycle. This is measured from the low to the high that culminated Wave 1 in March of 2008. The end of that cycle culminates in July of 2014. This suggests the end of Wave 5 at $65.00 and change, or $91.49. I want to give you a wide view of the 15 month cycle starting from the high in 1980. Notice how it showed nearly every trend change since then, including the low in 2008, the high in 2011, and what I think is the low in July of this year. This cycle ends in October of 2013 and in January of 2015. This chart shot shows the Fibonacci extension numbers from the 2008 low, the 2011 high and the low in June of 2012. The 1.000 extension comes in at $67.53. The 1.618 extension intersects with the cycle end in October, as well as the Gann 3x1 line at a price of $93.13. Earlier, I promised you that I would show you why I think the 4th wave ended in June of 2012. Let's take a look at this chart. This is a weekly chart with the 65 period cycles, which is the same as the 15 month cycle. This cycle terminated in July of 2012, and the low was in June. Note that the 1.618 extension of the Wave 3 move is $91.98; eerily close to the $91.49 price that we got earlier from the monthly chart. This indicates to me that the rally from the low in June, and subsequent completion of the ABC correction of that wave, which I detailed in a previous video (click here to view ) sets us up for the next impulse wave higher. "Based on my analysis, I think silver will go above $90.00 in 2013, on its way to much higher prices later on ," Roy said. Additional disclosure: The information in the Market Commentaries was obtained from sources believed to be reliable, but we do not guarantee its accuracy. Neither the information nor any opinion expressed therein constitutes a solicitation of the purchase or sale of any futures or options contracts. |
 |
 |
 |