Send this article to a friend:
November
07
2023
Send this article to a friend: November |
Stocks decided last week to trust J. Powell to save them. They will be wrong.
It is timely to share that part of the “Deeper Dive” today because stocks, today, quickly lost steam and did what I thought they would do in the “Deeper Dive.” Where people started thinking the flash upward at the end of last week meant the “correction” was over, I came across many articles on a normally bullish sight this past weekend (Seeking Alpha) that believed, as I do, the market is back on a bearish downtrend. The titles of the articles in today’s news below, just to bring them up into the editorial here, are…
What we saw last week, according to one of those articles, was an enormously shorted Treasury market, and others I read spoke of an enormously shorted stock market, trapping people in their shorts, forcing them to make good on purchases at higher prices — a “short squeeze” — driving prices up even further. It was, in fact, said to be a squeeze for the record books, and those three days got a lot of the upward pressure on stocks released already. So, the articles noted the big action was likely over. It was one VERY big short squeeze because many investors became convinced the market was going back into the bear zone, as well they should, as am I. Now, here was the section on stocks from that “Deeper Dive”: Stocks in bondage Now let’s take a look at stocks from a virtual unknown (at least by me) who has an interesting graph. Stocks are acting as if they we are right on the cusp of recession, too. Look at this graph on SA by Grindstone Intelligence: 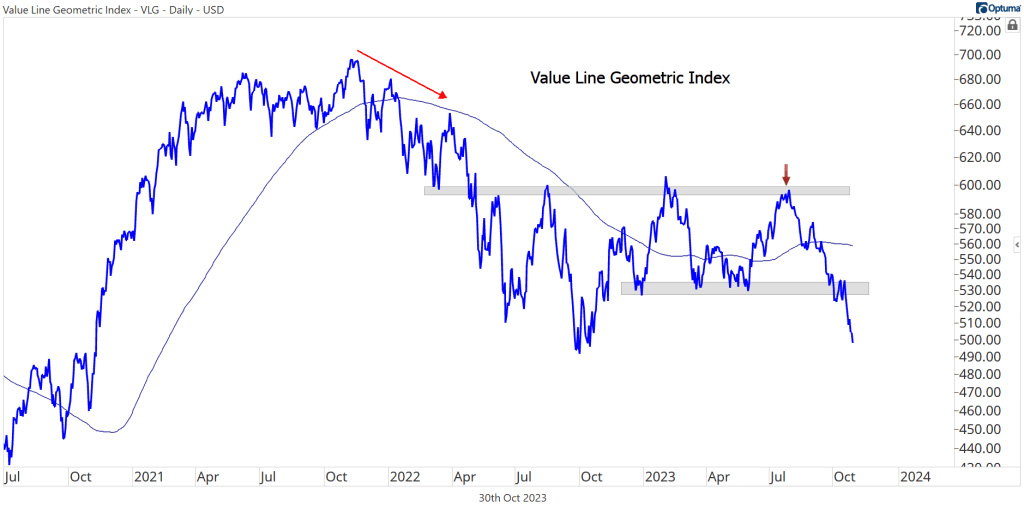
The median stock value has clearly dropped out of a long trading range that goes back to last October, and is almost down to the low it hit last September. Clearly if it breaks below that level a cliff dive looks likely because it has a ways to go to find any support. It is matching down against the rising side of the graph to where it once found resistance and climbed then climbed a cliff (or a wall of worry).
The bounce over the last two trading days may have in part been a bounce off that resistance, but were primarily a euphoric reaction to the Fed’s words that is not justified by what the Fed will be doing and were amplified by an enormous short squeeze when that rise hit and hurt those shorting the market. Stocks have, as I said a week or two back, come to a precipice where they are perched precariously. Maybe the upward jolt of the last two days will take them safely off this ledge, but I think that is a pipe dream based on false Fed hopes from a dovish sounding (and unrealistic) Powell and not based on the myriad economic realities around them. We can see what the year-long crash in stocks last year looked like and this is setting up so far to look the same (and is already much worse than the drop during the banking crisis this past spring) and is happening in a worse economic environment, including the inflation environment (which is no longer falling month-on-month): 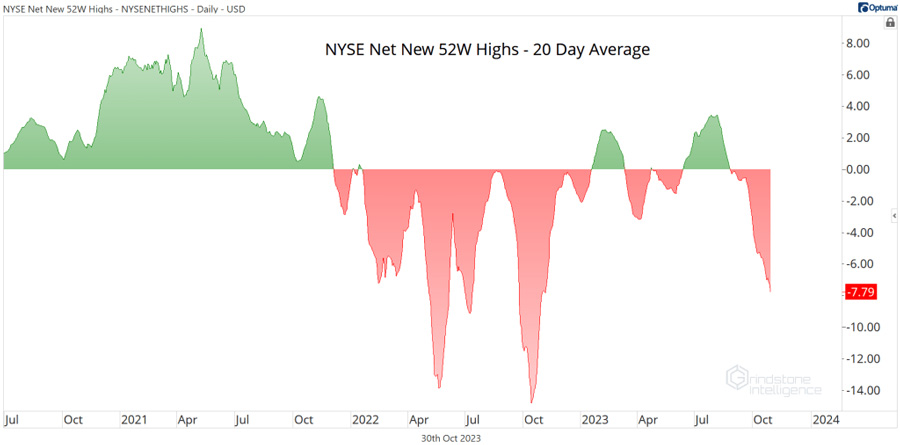
It appears to me we are going back down into the bear zone, and the Big Bond Bust will ultimately assure we do while geopolitical situations certainly will not help the situation, nor is rising inflation helpful. The termination of the “resilient consumer” who has finally used up all his stimulus reserves and piled credit on top of rising interest rates virtually assures a recession, which factory metrics everywhere but in the US clearly show we’re heading down, and even US factory metrics that made a small move up, are still on an overall downtrend that sits on the cusp of recession. If you look at the stocks of smaller companies in the Russell 2000, that index sits on the edge of a much deeper precipice: 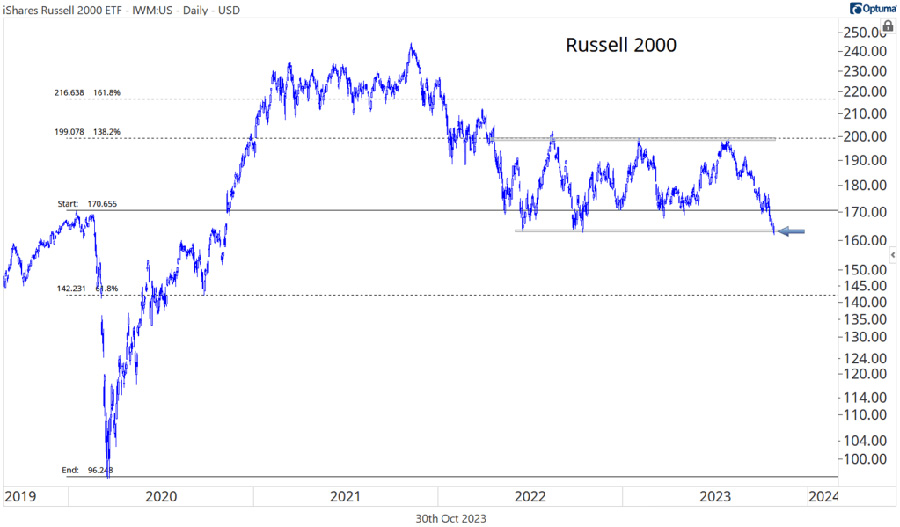
It has moved below its bottom line of support in the sideways trend to where it is now just below the point from which it took its 2020 Lockdown cliff dive, so it has no major support levels remaining from the past three years. And if you go to the smallest of small stocks … 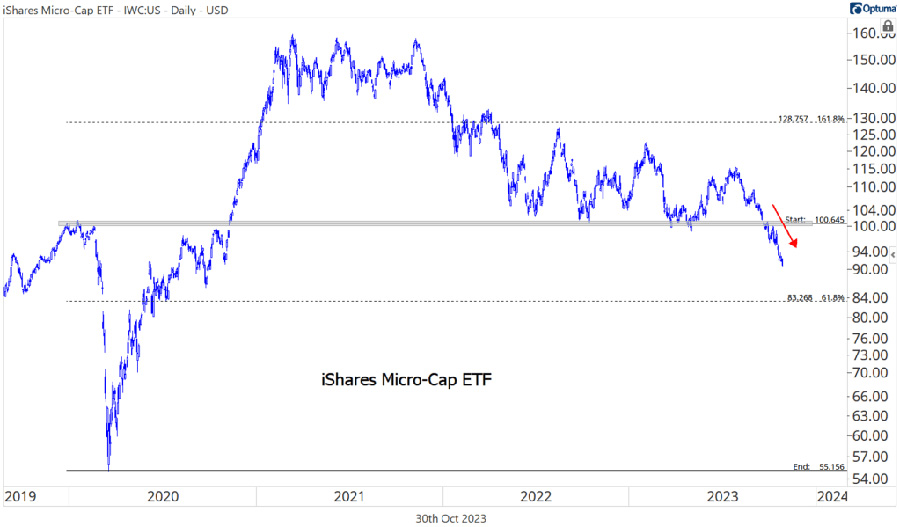 Worse still. You can bet on stocks to ride this out if you want to, but I sure won’t. If not for the AI boom, there would be no uplift in any index. I am sure some AI companies will be the wave to come, but can anyone say “dot-com bust” for now? The AI companies that come out of that may go gangbusters, but we are just going into that, not out. This recession is like the 70s-80s double-dip stagflation recession andthe dot-com bust together; and now, with housing the housing market frozen over but poised for a crash whenever the ice dam breaks (clearly not a breakthrough to higher prices under rising interest rates), we can pile in the Great Recession, too. We have, however, entered the single best month for stocks historically. So there is that tail wind, but let us not forget what happened to stocks during the Fed’s last failed attempt at QT. They crashed in October, then rebounded a good bit in November, only to crash harder and lower in December into a bear market. I think we are setting up for a replay of that as well … or worse. Santa Claus and his traditional flying, sled-hauled rally better put on an extra pair of long underwear for the chill settling over this stock market if he is going to deliver presents to stock investors when the Big Bond Bubble Bust resumes and inflation proves to be back on the rise in a way the Fed can no longer deny. I, of course, could be wrong about all of this, but EVERYTHING is moving in line with those predictions so far! How big is that fall likely to be before it finds its support? I’ve said all along I think we go down to around the 2200 level on the S&P: 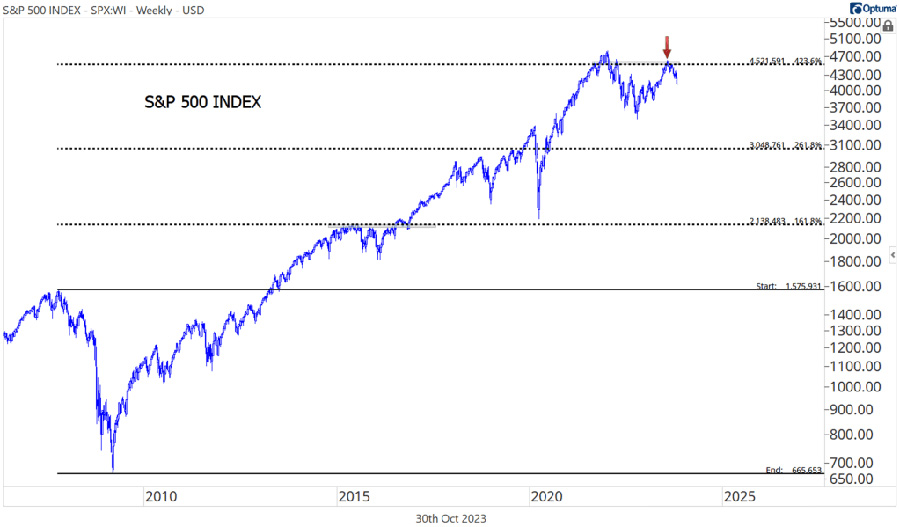 That is where stocks found major support in the 2020 plunge because that is where the market found two full years of resistance on the way up back in 2015-2016 (which tends to become support when you’re on the way back down. I’ve laid out other metrics that place the ultimate bottom between 2200 and 2400 in the past. So, I’m still holding to that bet, too. Of course, if conditions at the time create momentum that busts through that 2015-2016 trading range, the next realm of support doesn’t come until the top of the big crash into the Great Recession. Stocks are perched very precariously right now with no fundamental means of support from the economy and not a lot of immediate chart-dynamic support either.
Re-inflating Inflation That was the one section on stocks, but what a stock crash really all depends on is what Powell does. Will he be as dovish as he sounded to stock AND bond investors last week whose recently rising prices are entirely dependent on J-Pow’s dovishness since the economy is giving them no support? Will inflation let him? That is really the rub, and another section of that “Deeper Dive” (available to paid subscribers only) laid out some of my reasons (and those of other people) for saying inflation is NOT going to cut Powell a break. Others beside me, are now noting with due caution, as I have been, how inflation has returned to a clear rising trend and how Powell is not speaking straight with the US people when he says it is still falling. I also pointed out the precipitous plunge that just happened in the Atlanta Feds’ projections for GDP this quarter alongside the projections of numerous economists the Fed follows. I brought together a couple of articles about the faker in jobs reports and laid out the critical change rise in unemployment that places us in a recession this quarter unless the turn proves to be temporary due to the auto strikes, which we’ll know when we see the next report. I tried to bring together the key measures that are now screaming “stagflation recession,” including a comparison chart by former Clinton Treasurer Larry Summers that shows how exactly today’s inflation with its recent new rise matches precisely to the double hit in “stagflation,” a term coined by Summers, that we got back in the seventies.
I brought in manufacturing graphs that have clearly gone recessionary. I quoted articles that noted the same thing I’ve said here about booming sales being an actual sales crash, hidden by phantom inflation. Markit measured sales by unit, instead of by dollars, where there is no inflation to factor out. As I suspected, units sold were notably recessionary. Earlier sales figures only looked robust because the inflation factored out was way less than what consumers are actually experiencing. The Daily Doom is a reader-supported publication. To receive new posts and support my work, consider becoming a free or paid subscriber.
|
Send this article to a friend:
 |
 |
 |