Our Wall Street Crybabies Want the Fed to Stop QT, they Wag the Drop in Overnight RRPs
that’ll Blow up the Banks or Whatever
Wolf Richter
 This crybaby stuff is just funny. So let’s have a look. This crybaby stuff is just funny. So let’s have a look.
What we can loosely call our spoiled-rotten Wall Street crybabies – hedge fund magicians, investment bankers, bond-fund gurus, and what not – that got big and fat off the Fed’s free money, are now whining and crying and fearmongering about the Fed’s QT.
For now, they’ve homed in on the Fed’s Overnight Reverse Repurchase agreements (ON RRPs) that were at $2.3 trillion this spring and are now down to $935 billion and will go to near $0, as QT is draining liquidity from the system.
And they’re saying the banks – the banks, OMG!!! – or somebody will run out of liquidity if these RRPs are drained further and the financial system will implode or whatever, and the Fed MUST STOP QT NOW. Financial reporters eagerly pick up this manipulative BS and run with it, instead of pushing back, and instead of looking at what RRPs actually are, and instead of looking at a long-term chart of RRPs, where they normally are – namely at or near $0. So here they are, and we’ll get into the details in a moment.
ON RRPs are normally near $0. The spike resulted from mega-QE liquidity:
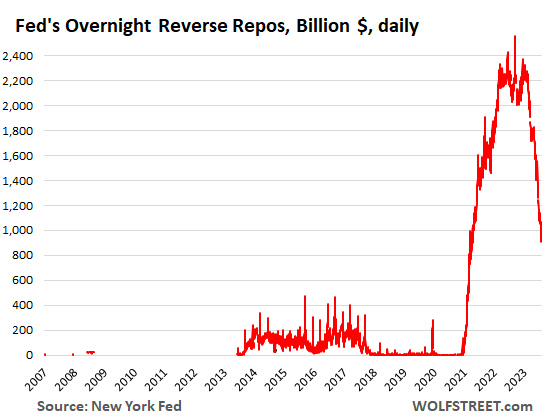
So this is the long-term chart of RRPs, and we’ll get into how RRPs are used by money market funds (MMFs); it’s where MMFs put their excess cash.
Note how the RRP balances rose from near-$0 during the final stretches of both bouts of QE – first in late 2013 and then again in March 2021 when the financial system was creaking under excess liquidity. And now they’re heading back to this near-$0 level, which is the normal level for RRPs.
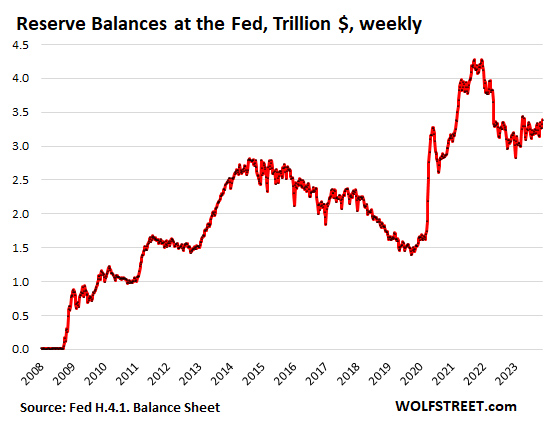
In a moment, we’ll look at a chart of “reserves” at the Fed, which is where banks put their excess cash, and those reserves have risen this year to $3.39 trillion.
ON RRPs at the Fed.
With these RRPs, the Fed takes in cash against collateral (Treasury securities). RRPs are a liability on the Fed’s balance sheet – amounts the Fed owes its counterparties which are mostly MMFs, but also government-sponsored enterprises (Federal Home Loan Banks, Fannie Mae, Freddie Mac, etc.), and occasionally banks.
These counterparties use RRPs to park their extra cash risk-free at the Fed, and the Fed pays them 5.3% in interest since the last rate hike.
This 5.3% is less than what the Fed pays banks on their reserve balances (5.4%), so banks don’t use RRPs much and not for long, though they might at the end of the quarter for regulatory window dressing. They normally use their reserve accounts at the Fed to park their extra cash because they earn more than RRPs, and because they’re more liquid than RRPs.
The dropping RRP balances mean that money market funds are shifting cash from RRPs into T-bills. The primary T-bills targeted by MMFs are at the short end, with maturities of up to 3 months, which are now paying over 5.5% in yield, over 20 basis points higher than RRPs (5.3%). So that makes sense, and MMF holders are making a little more yield as well. That’s how it should be.
ON RRPs, the outlet for excess liquidity.
RRPs are a sign of massive excess liquidity in the system; they’re an outlet created by the Fed to absorb this excess liquidity, and when the system begins its long slow trip back to something more normal under QT, this cash starts draining back out of the Fed’s RRPs into T-bills, which is how it should be.
The Fed started paying interest on RRPs in the spring of 2021, at first 0.05% APR and then 0.1% APR, minuscule amounts of interest but they worked. Back then, it’s policy rates were still near-0%, and it was still perpetrating QE even as inflation had begun to rage.
At the time there was so much liquidity in the financial system, chasing after everything including T-bills by MMFs that were awash in cash, that T-bill yields were dipping into the negative.
MMFs that heavily invest in T-bills are threatened by negative yields; they could cause the MMFs to “break the buck” where the Net Asset Value of the fund drops below $1, which could trigger a run on the fund, followed by forced selling by the fund, the collapse of a fund, contagion from there, etc., etc., the financial panic routine.
MMFs flocked to RRPs because 0.05% and then 0.1% was better than T-bills that had 0% or negative yields. And T-bill yields stayed above 0%. By August 2021, RRPs had shot past $1 trillion.
RRPs as an outlet for excess liquidity stopped the threat to MMFs that 0% or negative T-bill yields had posed.
Starting with the rate hike in March 2022, the Fed also hiked the rates it paid on RRPs. By May 2022, RRPs hit $2 trillion.
In addition, MMFs switched some of their cash that they need for liquidity reasons from their bank accounts to RRPs, since banks paid 0% interest. This shift from banks to RRPs via the MMFs caused the banks’ reserve balances to fall starting when QE ended. More in a moment.
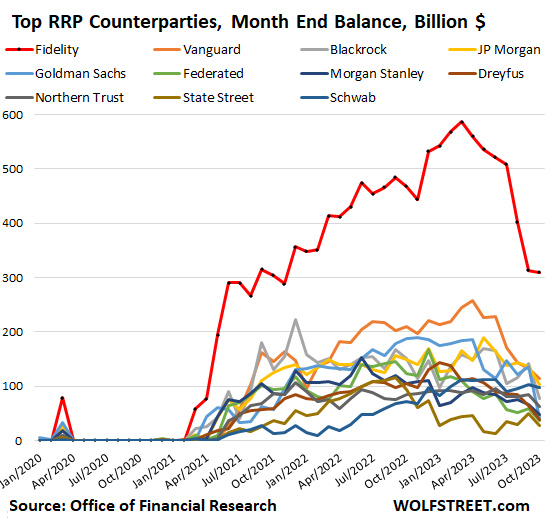
MMFs held over 95% of ON RRPs. Which Money Market Funds?
On October 31, MMFs were counterparty to $1.084 trillion in RRPs, according to the government’s Office of Financial Research which releases RRP balances by MMF provider on a monthly basis.
Total RRP balances on October 31 of $1.137 trillion indicate that only $53 billion of RRPs were from counterparties other than MMFs. In other words, MMFs accounted for over 95% of overnight RRPs.
The biggest providers of money market funds lead the list: Fidelity’s funds with $310 billion; Vanguard’s funds with $114 billion; JP Morgan’s funds with $102 billion; and Blackrock’s funds with $77 billion. Note how they had $0 or near$) RRPs before April 2021:
Banks put cash in “reserves,” not RRPs: $3.39 trillion.
Reserves have risen to $3.39 trillion, the highest since March. Reserves are cash that banks put on deposit at the Fed. They’re a liability on the Fed’s balance sheet, amounts that the Fed owes the banks.
For banks, reserves are assets. Banks call them “interest-earning cash” or similar on their own balance sheets. They use their reserve accounts at the Fed to transfer cash between banks, to do business with the Fed, to have instant liquid cash available when needed, and to earn interest. Since the last rate hike, the Fed pays 5.4% in interest on reserve balances.
Since banks earn more on reserves (5.4%) than on RRPs (5.3%), they normally use reserves to store their excess cash.
It’s reserves that indicate liquidity in the bank system, and those reserves are showing that the banking system is awash in liquidity, and they can drop to close to $1.5 trillion before the first ripples might appear – as we saw in late 2019 when the repo market started trembling.
Rising or falling RRPs and reserves don’t negate effects of QT or QE. They’re consequences of them.
The Fed’s big four liabilities are RRPs, reserves, currency in circulation, and the government’s checking account (TGA). Total liabilities rose during QE in equal measure with total assets. And they had to.
On all balance sheets: Assets = liabilities plus capital. Always, always, always.
When capital doesn’t change much, as is the case with the Fed whose capital is set by Congress, each $1 increase in assets causes liabilities to rise by $1. And each $1 decrease in assets causes liabilities to decrease by $1.
So rising liabilities don’t negate QE; they’re part of QE. And falling liabilities don’t negate QT; they’re part of QT. So neither falling RRPs nor falling reserves negate QT; those declines are an essential consequence of QT.
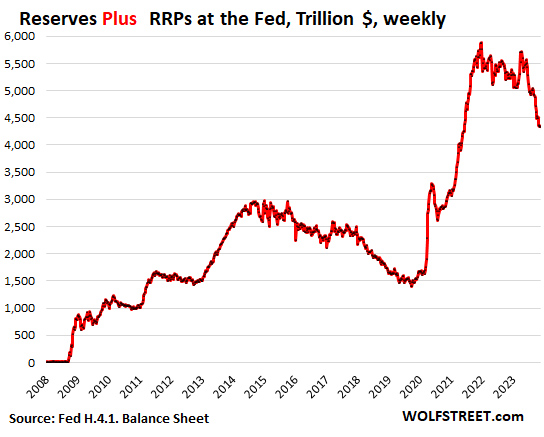
Combined excess liquidity at banks and MMFs: Reserves plus RRPs.
There are big shifts of cash between reserves and RRPs via the MMFs, and it makes sense to look at them together to see the combined amount of liquidity that is getting drained out of the financial system via QT.
Before QE, until September 2008, RRPs were essentially $0, and the then so-called “excess reserves” were minimal, and the combined total was minimal. Then the Fed started QE during the Financial Crisis, and both those measures began to inflate. The reserves inflated with each wave of QE. The pandemic-era QE had inflated the combined total of Reserves plus RRPs to $6.18 trillion in December 2021. On last Thursday’s balance sheet, after $1.1 trillion in QT, the combined total had fallen by $1.8 trillion, to $4.34 trillion.
So this chart shows the progress of QT draining excess liquidity from the financial system. If the Fed had any stomach, and abandoned its newfangled “ample reserves” regime, it could drain them to near-$0, where they had been before September 2008. If the Fed maintains the “ample reserves” regime, it could still drain them below $2 trillion, amid the hue and cry by our spoiled-rotten Wall Street crybabies.
Enjoy reading WOLF STREET and want to support it? You can donate. I appreciate it immensely. Click on the beer and iced-tea mug to find out how:

Would you like to be notified via email when WOLF STREET publishes a new article? Sign up here.
 Founder, Wolf Street Corp, publisher of WOLF STREET. Founder, Wolf Street Corp, publisher of WOLF STREET.
In his cynical, tongue-in-cheek manner, he muses on WOLF STREET about economic, business, and financial issues, Wall Street shenanigans, complex entanglements, and other things, debacles, and opportunities that catch his eye in the US, Europe, Japan, and occasionally China.
Wolf lives in San Francisco. He has over twenty years of C-level operations experience, including turnarounds and a VC-funded startup. He has a BA, MA, and MBA (UT at Austin).
In his prior life, he worked in Texas and Oklahoma, including a decade as General Manager and COO of a large Ford dealership and its subsidiaries. But one day, he quit and went to France for seven weeks to open himself up to new possibilities, which degenerated into a life-altering three-year journey across 100 countries on all continents, much of it overland, that almost swallowed him up.
wolfstreet.com
| 

![[Most Recent Quotes from www.kitco.com]](http://www.kitconet.com/images/live/s_gold.gif)
![[Most Recent USD from www.kitco.com]](http://www.weblinks247.com/indexes/idx24_usd_en_2.gif)
![[Most Recent Quotes from www.kitco.com]](http://www.kitconet.com/images/live/s_silv.gif)