Send this article to a friend:
November
19
2014

|
Send this article to a friend: November |
|
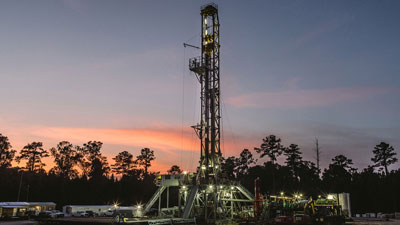
What Blows Up First? Part 5: Shale Oil Junk Bonds
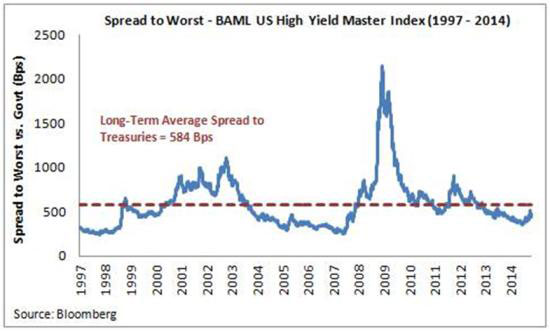
This pretty much sums up today’s fixed income world. And if past is prologue, soon to come will be a brutally rude awakening. Most of the following charts are from a long, very well-done cautionary article by Nottingham Advisors’ Lawrence Whistler: Junk yield premiums over US Treasuries are back down to housing bubble levels:
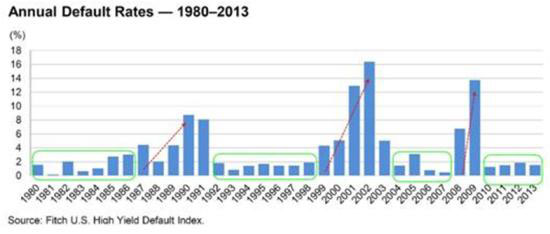
So are default rates:
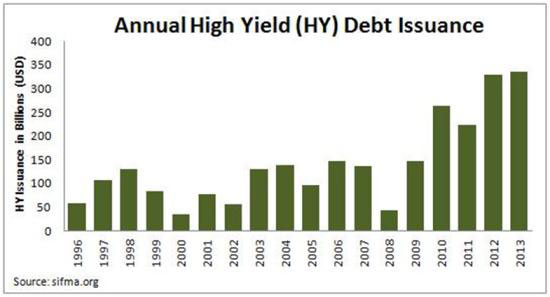
The supply of junk bonds is way higher than before the previous two market crashes:
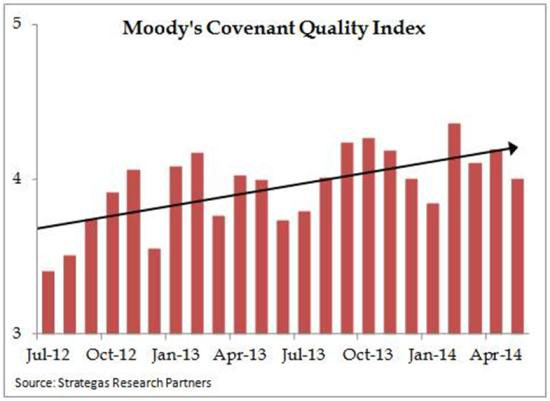
The issuance of covenant-light loans — the crappiest kind of junk — is rising. On the following chart a higher number means lower quality:
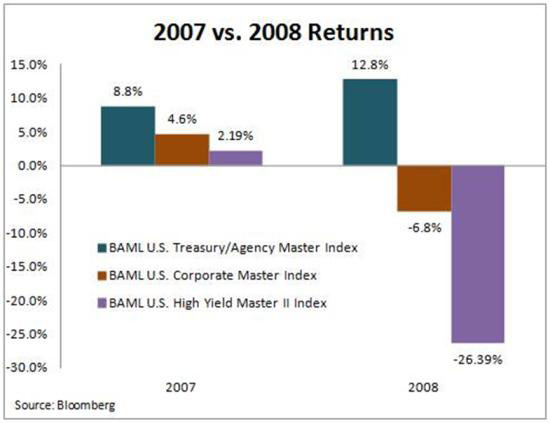
Here’s what happened to the various classes of debt the last time things got this out of whack (junk is purple):
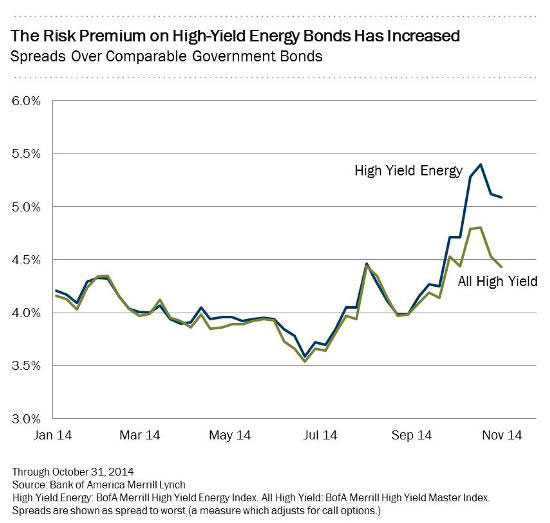
As for what might cause the junk market to crack, one prime candidate is the oil industry. The shale boom has led a lot of energy companies to ramp up production using other people’s money, much of which is coming from junk bonds. Now, with oil down from $100/bbl to around $80, the nice fat coverage ratios on these bonds are looking disturbingly skinny. This chart shows the divergence between overall junk spreads and energy-sector junk spreads.
The weakest of these companies will default in the coming year, and if oil prices fall another $10, perhaps most of these companies will default. This will of course be dismissed as a localized disturbance unlikely to spread to the broader economy — which is exactly what they said about subprime mortgages last time around.
|
|---|
Send this article to a friend:
 |
 |
 |