
Send this article to a friend:
September
20
2023

|
Send this article to a friend: September |
|
Central Bankers Wandering in the Woods
In recent quarters, the Fed has shown admirable resolve in responding to inflationary pressures. On the interest rate front, the Federal funds rate is now close to systematic benchmarks that have historically been consistent with prevailing core inflation, nominal GDP growth, and unemployment. Though we estimate that core inflation may remain in the 3-4% range longer than investors seem to expect, an easing of inflation, nominal growth and labor tightness would make it reasonable to ease interest rates as well. Unfortunately, a couple of percent in above-target inflation is probably not the central problem the Fed will face in the next few years. While the Fed has suspended the “zero interest” part of its experimental policies, it has been extraordinarily slow to reduce its balance sheet to a size that would allow it to manage interest rates without hundreds of billions of dollars of annual public expense. The Fed has done only half its job, and seems insistent on maintaining a ruinously bloated balance sheet. The real problem is that a decade of experimental distortion encouraged unprecedented speculation in every conventional asset class, not to mention fringe speculation in assets detached from any standard of value, including meme stocks, pictures of bored monkeys, and digital Pokémon posing as “currency.” As with every similar episode across history, the unwinding of this bubble in the form of financial crisis is already quietly baked in the cake. In defending the deranged and experimental notion of an “ample reserves regime,” the Fed is defending continued misalignment between monetary aggregates and economic output. It is defending exactly the element of monetary policy that contributed to a decade of yield-seeking financial speculation, forced $8 trillion of uninsured deposits into the banking system, encouraged the passive acceptance of enormous government deficits, leaves in place the fuel for future episodes of inflation, and has already produced trillions of dollars of losses both in commercial banks and in the Fed itself – invisible because the assets are not marked to market. Even as the Fed battles the flames of a fire-breathing dragon, it insists on keeping that dragon as a house pet. Apropos of September’s summit of central bankers at Jackson Hole, it may be useful to discuss what “data dependent” means, if the phrase is to mean anything at all. There are two key aspects of monetary policy that the Fed has to get right, if it wishes to serve the public and support the economy, without inadvertently setting up destructive consequences. One is to act as a lender of last resort for the banking system, subject to important constraints. The second is to align monetary quantities (mainly currency and bank reserves) with economic quantities (mainly economic output), ideally in a way that supports certain goals including employment, price stability, and moderate long-term interest rates. In the discussion below, notice the unintentional risks, instabilities, and public costs that have been introduced by a decade of dogmatic quantitative easing and zero interest (until recently) policies. Some segments may be familiar – if I repeat certain points from time to time, it is to counter the nonstop deluge of data-free gibberish that passes for economic analysis. I’ve updated and extended some previous charts and commentary to describe how various systematic, activist, or reckless policy decisions can produce beneficial, weak, or economically damaging consequences. What follows may also build context around the current economic outlook and some of the most salient risks. Gimme some money
In its role as a “lender of the last resort” for the banking system, the job of the Fed is essentially to follow Bagehot’s Rule: in a financial crisis, lend freely, to solvent – if illiquid – entities, strictly on the basis of sound collateral, ideally at interest rates high enough or lending terms short enough to discourage needless or opportunistic borrowing. Much of this is actually codified in the Federal Reserve Act. For example, Section 13(3) – revised under Dodd-Frank in 2010 to read like a children’s book, following PIMCO wide receiver Ben Bernanke’s relaxed interpretation of law – requires Federal Reserve policies “designed to ensure that any emergency lending program or facility is for the purpose of providing liquidity to the financial system, and not to aid a failing financial company, and that the security for emergency loans is sufficient to protect taxpayers from losses and that any such program is terminated in a timely and orderly fashion.”
Likewise, Sections 13(2) and 13(8) are rather aggressive in specifying what Congress intends as collateral: “such definition shall not include notes, drafts, or bills covering merely investments or issued or drawn for the purpose of carrying or trading in stocks, bonds, or other investment securities, except bonds and notes of the government of the United States.” The purpose of this restriction is simple: if the Fed was to buy stocks or unsecured corporate debt, and the securities went belly-up, it would have effectively created public funds to bail out private investors, with nothing to cover the expense. This would be fiscal policy, and under the U.S. Constitution, the power to spend is strictly reserved by Congress. On this point, it’s worth noting that during the pandemic, Congress provided specific funding for emergency loans by the Federal Reserve in Section 4003(b)(4) of the CARES Act, but again, as if instructing a wayward child, Congress used all-caps to open Section 4003(c)(3)(B): “FEDERAL RESERVE ACT TAXPAYER PROTECTIONS AND OTHER REQUIREMENTS APPLY – For the avoidance of doubt, any applicable requirements under section 13(3) of the Federal Reserve Act (12 U.S.C. 343(3)), including requirements relating to loan collateralization, taxpayer protection, and borrower solvency, shall apply with respect to any program or facility described in subsection (b)(4).” Exactly for that reason, Congress pushed back when the Fed announced that it was buying junk debt and unsecured corporate bonds, pushing those securities into “special purpose vehicles” and acting as if these securities stood as their own collateral. Ultimately, the Fed limited its purchases of corporate debt to less than $20 billion, in an $11 trillion corporate bond market. Congress did not, and does not, intend the Fed to lose enormous amounts of money that could otherwise be used for public benefit.
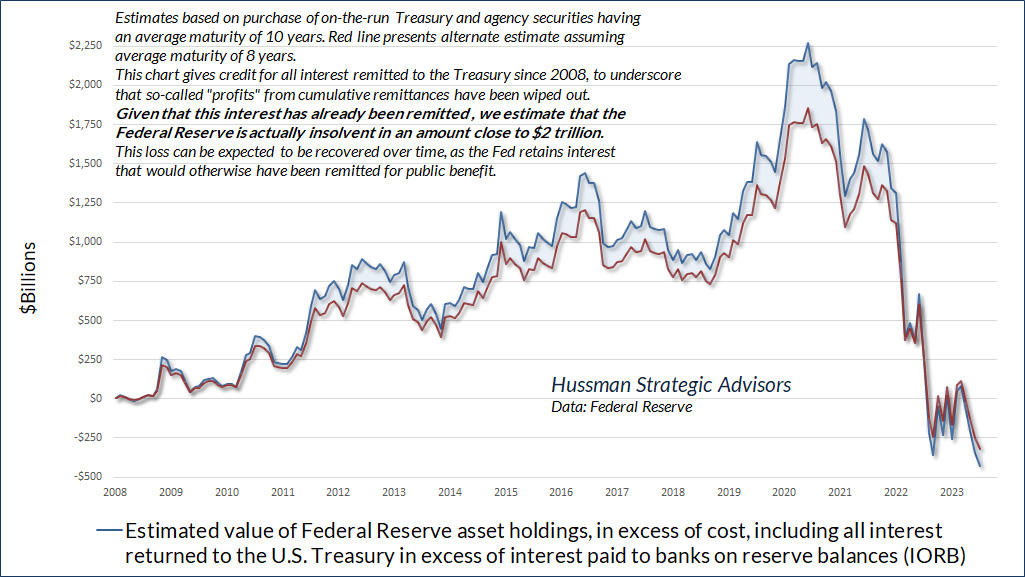
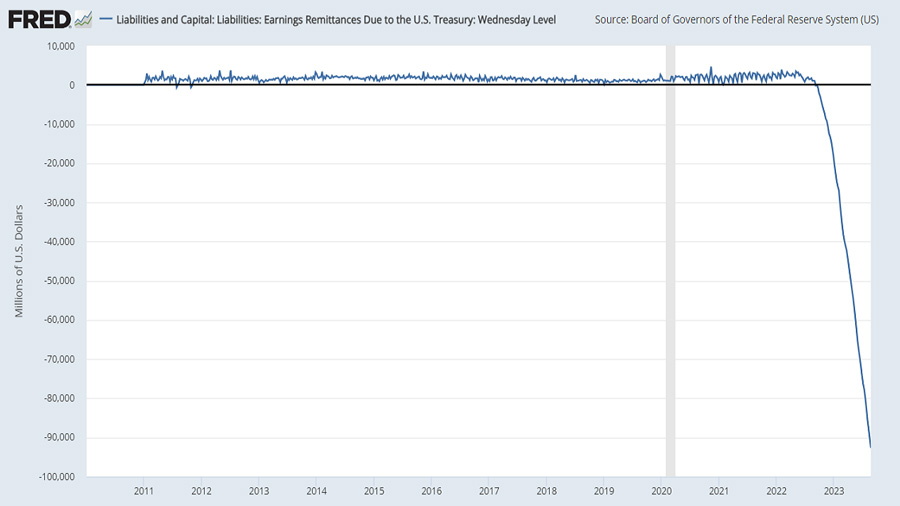
In March 2023, Silicon Valley Bank and Signature Bank failed due to the combination of balance sheet losses coupled with a run on uninsured deposits. In response, the Federal Reserve created a new “facility” called the Bank Term Funding Program (BTFP), which provides loans to banks, taking government securities as collateral – which is fine – but also makes those loans on the face value of those securities, not their market value. In doing so, the Fed is effectively lending funds to banks on which the collateral is not actually “sufficient to protect taxpayers from losses” – unless the securities are held to maturity, which contradicts the requirement to terminate the facility “in a timely and orderly fashion.” Sigh. At least they’re government securities. Meanwhile, the Fed is paying banks 5.4% interest on trillions of dollars of reserves that it forced into the banking system. In effect, the Fed has taken the losses of private banks onto its own books, at least until 2024, while those banks are gradually subsidized with interest paid, at public expense, by the Fed, whose holdings are also not marked to market. In case you’re keeping score, the chart below shows our estimate of Federal Reserve losses, giving full credit to the Fed for all the interest that it has remitted to the Treasury since 2008. I’ve done this to emphasize the fact that even this interest (which the Fed often calls its “profit”) has been wiped out. Of course, having already returned that interest, the true hole in the Fed’s balance sheet is greater – we estimate this loss to be nearly $2 trillion.
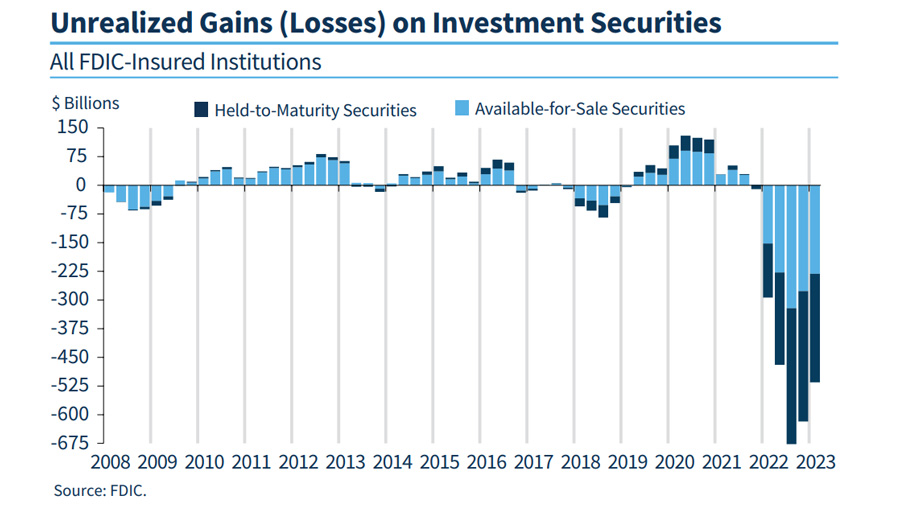
The typical knee-jerk dismissal of this loss is to say “The Federal Reserve can print money, so it can never be illiquid or insolvent.” That’s not how it works. The Fed cannot simply create money to cover its losses. Although the Fed can create money when it buys a security, that money goes to the seller of the security. Illiquidity means that you are unable to make your payments. The thing that allows the Fed to avoid illiquidity is that Congress has not yet pushed back on the Fed’s practice of creating money to pay for expenses such as interest to banks, which the Fed does by inventing a balance sheet entry that calls dibs on future interest that it receives on government bonds, instead of returning it to the Treasury for public benefit. In that sense, the Fed is not illiquid, even though it is currently receiving less interest than it is paying out. Insolvency, on the other hand, means that your liabilities exceed your assets. The Fed is most definitely insolvent here. This presently has no legal effect, but we should all understand what’s going on, because one consequence of QE is that the Fed intends to hold onto every penny of interest it receives on the government securities it holds on its balance sheet – at public expense – until this hole is filled. The chart below is from the FDIC Quarterly Banking Profile through the first quarter of this year. Notice that the profile of bank losses resembles the preceding chart of estimated Federal Reserve losses, except that data since March 2023 isn’t yet available. You’ll notice that losses reached their worst point in the third quarter of 2022, followed by two quarters of improvement as Treasury yields retreated. Given the spike in 10-year Treasury yields above 4% in recent weeks, my impression is that bank losses are quietly plumbing fresh depths.
Every one of the $8 trillion dollars the Fed has created must be held by someone in the economy, as a dollar. Those dollars take only three forms: currency in circulation (read the top line of any dollar bill), bank reserves (held indirectly by the public as bank deposits) and funds on reverse repurchase (held indirectly by the public as money market balances). If someone tries to put their dollars “into” stocks, the seller of the stocks takes those dollars right back “out.” Someone has to hold the stuff, at every moment in time, until the Fed retires it by reducing its balance sheet. This so-called “cash on the sidelines” never becomes something else. It can only change hands until the Fed retires it.
For an extended, data-rich discussion of how the Federal Reserve, commercial bank, public, and investor balance sheets are related, see the May comment, Money, Banking, and Markets – Connecting the Dots. Balance sheet reduction, or “quantitative tightening” is a simple operation: As Treasury debt held by the Federal Reserve matures, the Treasury refinances by issuing a new debt security. Someone in the public buys that newly issued Treasury debt and pays for it with dollars. The Treasury takes those dollars and gives them to the Fed to pay off the Treasury debt that just matured. These dollars, having come back to the Fed, are “retired”. The Fed now has fewer assets (Treasury bonds) and fewer liabilities (dollars). The public now holds more Treasury bonds as assets, and fewer dollars (currency, bank deposits, or money market balances) as assets. Balance sheet reduction is the onlyway that this so-called “cash on the sidelines” disappears. You have one job
While the monetary policy objectives set by Congress identify several goals the Fed is expected to promote, the Fed is given only one mandate, and it is the phrase that follows the word “shall”: Maintain long run growth of the monetary and credit aggregates commensurate with the economy’s long run potential to increase production. Fed officials like to gloss over the “shall” part of their mandate, preferring to fabricate what they call the “dual mandate” of balancing unemployment versus inflation. As I detailed in Fabricated Fairly Tales and Section 2A, there is actually no such “tradeoff” in the data, and even the popular concept of the “Phillips Curve” is a misinterpretation of Phillips’ work, which is actually a relationship between unemployment and (real) wage inflation. The whole idea of a “dual mandate” is actually a constructive interpretation of 2A, evidently invented to divert attention from that pesky “shall.”
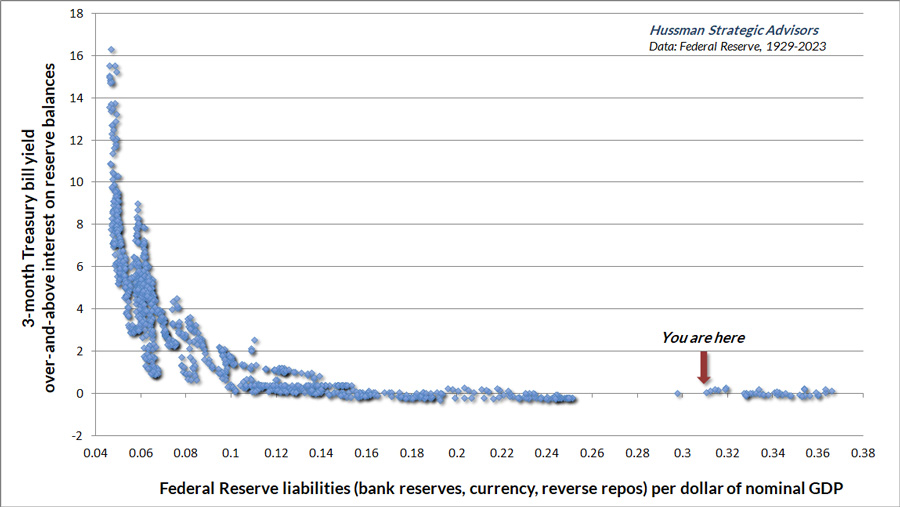
Historically, the liquidity created by the Fed has earned zero interest. As the Fed created more base money, relative to the size of the economy, savers became more eager to chase close alternatives such as Treasury bills. Of course, someone still had to hold the base money, but eventually T-bill yields would decline to a point where savers were indifferent between holding zero-interest bank balances or holding low-yielding Treasury bills. For the entire history of the Federal Reserve until 2008, the Fed conducted monetary policy and pursued its short-term interest rate targets strictly by changing the quantity of base money. The amount of base money never exceeded 16% of GDP. This is part of the reason I use the word “deranged” to describe the Fed’s experimental “ample reserves regime.” It is wholly outside of the range in which monetary policy has historically operated. It ignores the Fed’s 2A mandate. It breaks the link between open market operations and interest rates, to the extent that it is now impossible to hold interest rates at any level above zero without transferring public funds to the private sector in the form of interest on reserve balances, or accruing small but daily balance sheet losses through “reverse repurchases” with money market funds. The chart below shows how Fed liquidity is related to short-term interest rates, in data since 1929. It’s our version of what economists call the “liquidity preference curve.”
Notice that once the Fed expanded its liabilities beyond 16% of GDP, interest rates were reliably driven to zero. They would still be zero today, if not for the fact that the Fed is explicitly paying 5.4% interest to banks and money market funds on everything but the physical dollar bills in your pocket. Rather than targeting the Fed funds rate as Congress intended, through changes in the Fed’s balance sheet, the Fed has shown no concern for restraint, or for keeping its liabilities “commensurate with” GDP. Instead, it’s creating money to pay banks, and has invented an offsetting “asset” (technically, a negative liability) on its balance sheet. Let’s be clear – when you see a negative figure in “Earnings Remittances Due to the U.S. Treasury” on the Fed’s balance sheet, this is future interest that the Fed intends to keep rather than remitting it back to the Treasury. The losses here are in addition to the payments the Fed makes to banks using interest it currently receives on its assets. They are also in addition to the daily tick-tick-tick of balance sheet losses that the Fed quietly incurs by buying securities from money market funds each morning at a slightly higher price it sold them the night before (“reverse repurchases”).
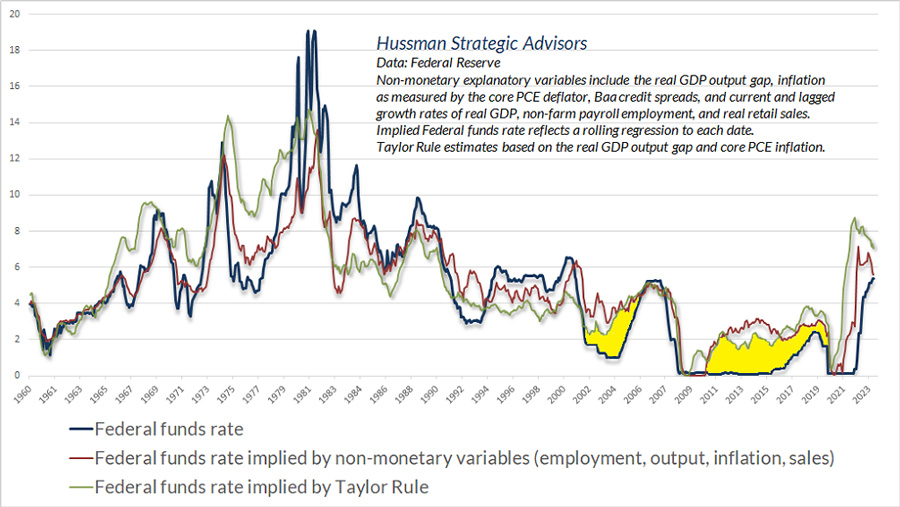
To the Federal Reserve’s credit, it has been gradually reducing the size of its balance sheet in recent quarters, but only at a snail’s pace. In my view, the Fed should reduce its balance sheet with every single security that matures, with no fresh purchases whatsoever. Presently, the Fed is paying 5.4% on the reserves it creates. Yet 10-year Treasury bonds presently yield just 4.2% and investors are willing to buy new issues at that yield. Let them. Doing so will cost the public less in interest on reserves. It will reduce the amount of uninsured deposits in the banking system. It will more quickly align monetary quantities with economic quantities. If there is one aspect of Fed policy that deserves credit for closer alignment with “systematic policy,” it has been the gradual adjustment of the Federal funds rate. Notably, the current Fed funds rate remains slightly lower than the systematic benchmarks that have historically been consistent with prevailing unemployment, core inflation, real retail sales growth, credit spreads, and the GDP output gap. Fortunately, the difference is no longer significant. In my view, the Fed has done its job with regard to interest rate targets, at least for now.
The areas in the preceding chart shaded in yellow show what I view as the most persistently reckless policy errors that the Fed has committed since 1940. While the Fed’s policies under Arthur Burns in the 1970’s were overly accommodative, largely under pressure from Nixon, the two yellow areas show periods when the Fed’s policies actively amplified financial speculation. Both ignore Walter Bagehot’s 1873 warning: “John Bull can stand many things, but he cannot stand interest rates of 2 per cent.” The first episode occurred under Alan Greenspan, when the Fed dropped the Fed funds rate to just 1% following the collapse of the tech bubble. Investors became starved for yield and reached for a “pickup” in yield by chasing mortgage securities, which they viewed as safe given that the U.S. housing market had never collapsed. That appetite for mortgage securities, and Wall Street’s eagerness to provide new and increasingly low-grade “product,” fueled a mortgage lending boom, a deterioration in credit quality, and a housing bubble that ultimately collapsed into global financial crisis. Unwilling to learn a lesson about Fed-induced yield-seeking speculation, Ben Bernanke doubled down on interest rate repression, first driving rates to zero by expanding base money past 16% of GDP, and then going full-on bananas with additional rounds of quantitative easing. Come to think of it, Bernanke joined the Federal Reserve Board of Governors in 2002, right about the time Greenspan’s monetary policy was replaced with back-to-back episodes of Jackass: every policy decision since then looks like it was based on a dare. Economist Allan Meltzer has described the shift as an abandonment of “rules-based” policy. John Taylor, my friend and former mentor at Stanford, describes it as “ad hoc” decision making:
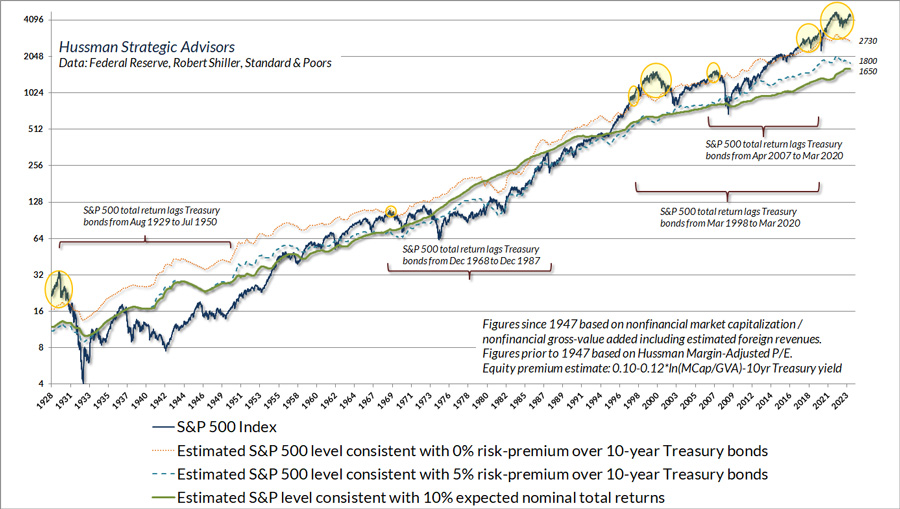
In my view, future financial crisis was again gradually baked into the cake, year-by-year, as Fed pursued Bernanke’s experiment of quantitative easing and zero-interest rate dogma. By 2022, the Fed had created 36% of GDP in zero interest liquidity. Someone had to hold it, and nobody wanted to. Every time one investor used the stuff to buy a security, the seller of that security would get the stuff. The endless but futile attempt to get rid of that $8 trillion in zero interest liquidity drove Treasury interest rates to the lowest levels in history and stock market valuations to levels that, on our most reliable measures, exceeded the 1929 and 2000 extremes. Valuations and their consequences Valuation bubbles are ultimately followed by dismal long-term returns, regardless of what causes the bubble. Indeed, a century of market history suggests that investors should expect S&P 500 total returns to lag Treasury bond returns for something on the order of 12-18 years. The green line in the chart below shows the level of the S&P 500 that we associate with historically run-of-the-mill estimated expected total returns averaging 10% annually. The blue dashed line shows the level consistent with S&P 500 total returns 5% above prevailing 10-year Treasury bond yields – the average “equity risk premium” observed in market cycles across history. The orange dotted line shows the level consistent with zero expected returns over and above 10-year Treasury yields. The yellow bubbles show periods when our most reliable valuation measures implied S&P 500 total returns below Treasury bond yields. I’ve included several brackets to emphasize that the S&P 500 did indeed lag Treasury bond returns in previous instances – not always immediately, but clearly over periods of a decade or more.
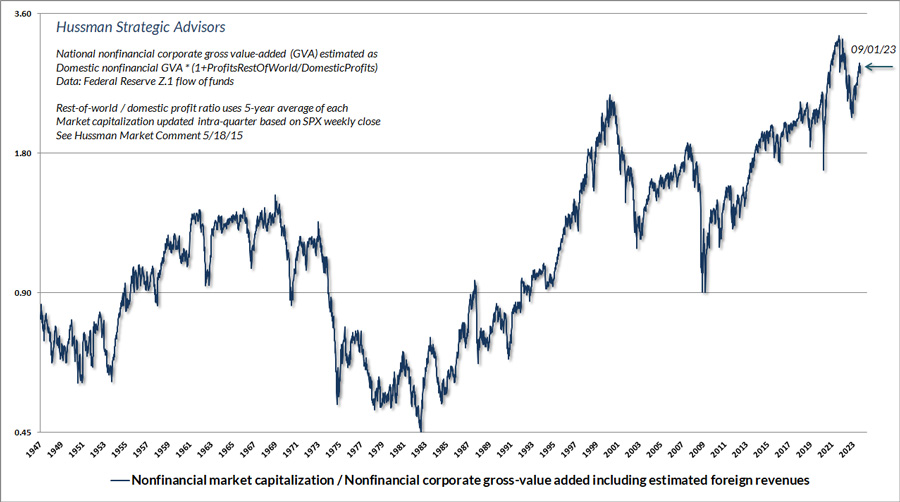
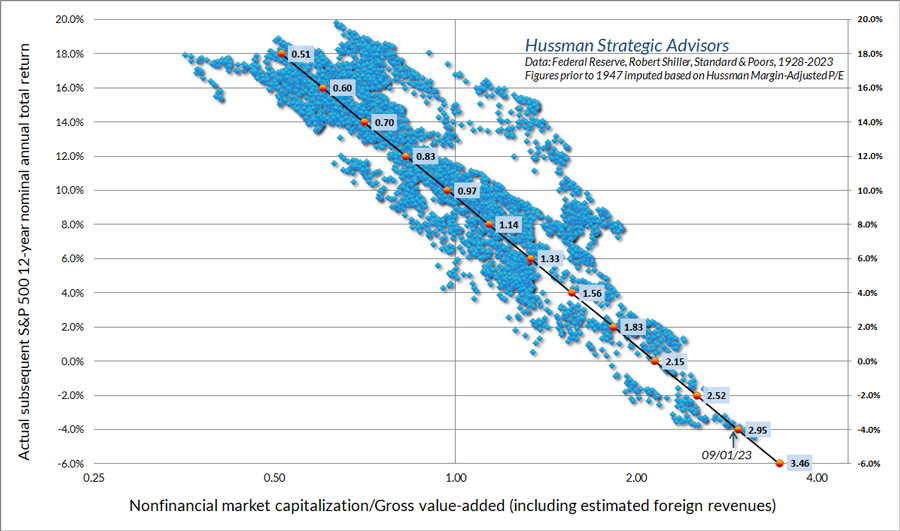
The chart below shows the ratio of nonfinancial market capitalization to gross-value added, which is the valuation measure that we find best correlated with actual subsequent S&P 500 total returns in market cycles across history. At present, our most reliable valuation measures are nearly 2.8 times the norms that we associate with historically run-of-the-mill expected total returns of 10% annually.
This scatter shows the relationship between MarketCap/GVA and subsequent 12-year S&P 500 total returns since 1928. The consequence of zero interest rates is that every conventional asset class was also driven to valuations that imply zero returns.
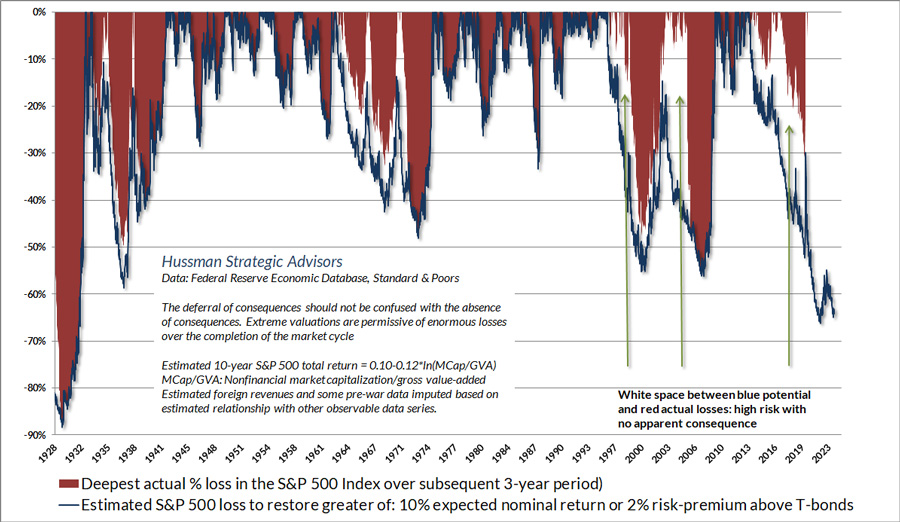
As a side note, we prefer a 12-year horizon for these estimates because that is typically the point where valuations in one year become uncorrelated with later valuations. In contrast, valuations in one year tend to be highly correlated with valuations the next, which is why valuations often exert very little influence on market returns over shorter segments of the market cycle. As I’ve detailed elsewhere – see, for example, The Structural Drivers of Investment Returns and the section titled “False justifications” in Headed For the Tail – it is difficult to dismiss current valuation extremes with appeals to large capitalization glamour stocks, interest rates, index composition, or profit margins bloated by pandemic deficits. Stocks are claims, not to next year’s operating earnings, but to a very long-term stream of cash flows that they will deliver into the hands of investors over time. We can easily allow for the possibility that future profit margins may be moderately and even permanently above their historical norms, but that assumption is not nearly enough to justify current extremes. Historically, the completion of a full market cycle has typically restored prospective S&P 500 total returns to the higher of a) their run-of-the-mill 10% historical norm or b) 2% above prevailing Treasury bond yields. At present, the S&P 500 would have to lose about 64% of its value to restore those norms.
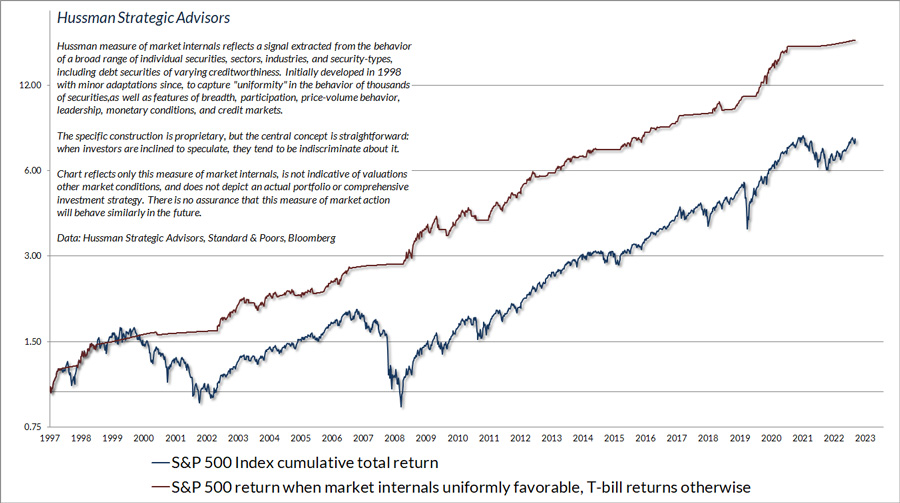
Emphatically, nothing in our discipline requires valuations to collapse to their historical norms. Rich valuations can become even richer, particularly in periods when investors remain inclined to speculate. In contrast, rich valuations can collapse without notice once investors become inclined toward risk-aversion, which we infer from deterioration and divergence in market internals across thousands of individual securities, industries, sectors, and security-types, including debt securities of varying creditworthiness. As I discussed in our 2023 Annual Report, we’ve adapted our discipline in recent years (particularly 2017 and 2021), abandoning our reliance on previously reliable “limits” to speculation, and restoring the strategic flexibility that we enjoyed in decades of complete market cycles prior to the recent bubble. Our most reliable measure of market internals has remained in an unfavorable condition despite a market rebound since October, which we describe as “grasping at the suds of yesterday’s bubble.” The chart below presents the cumulative total return of the S&P 500 in periods where our main gauge of market internals has been favorable, accruing Treasury bill interest otherwise. The chart is historical, does not represent any investment portfolio, does not reflect valuations or other features of our investment approach, and is not an assurance of future outcomes.
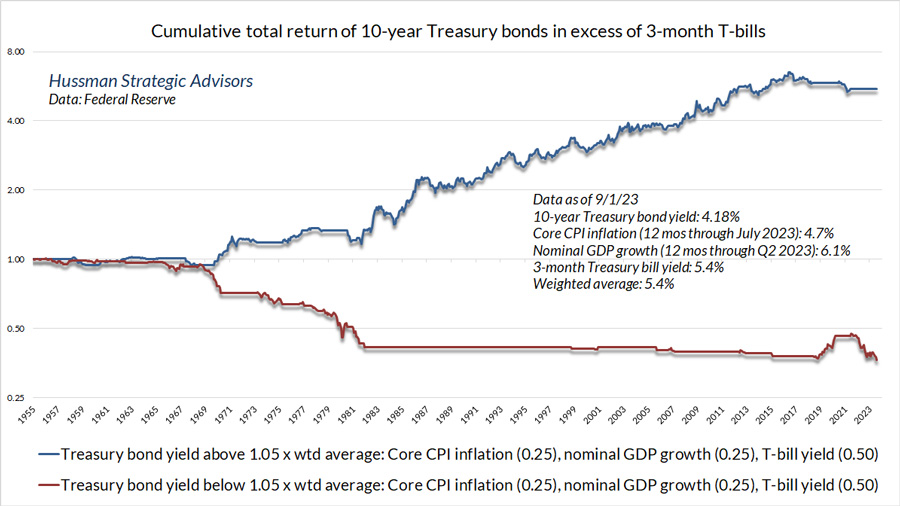
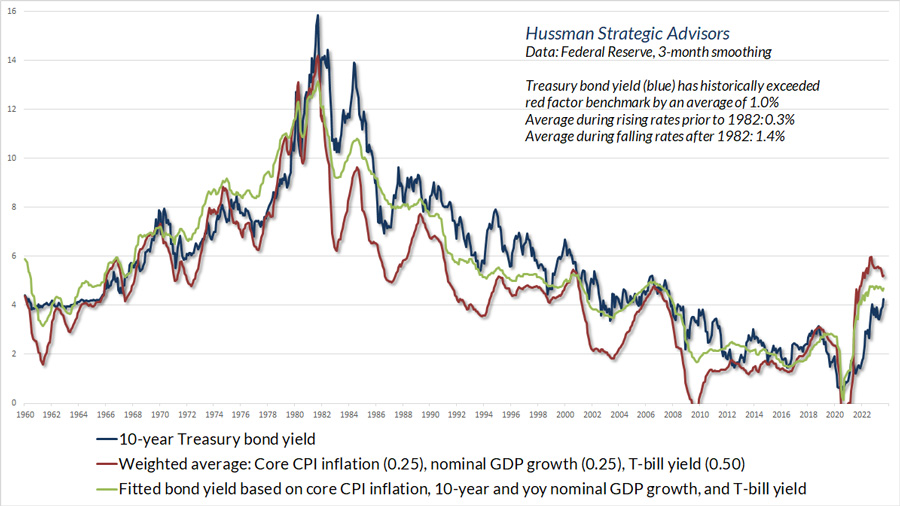
The Fed and the FDIC have tried to mitigate some of the early damage of the recent bubble, particularly as it affects depositors, but the losses to yield-seeking speculators in bonds have already emerged, and the losses to yield-seeking speculators in equities have only started. Current market conditions create what we continue to view as a “trap door” situation for the equity market. While the S&P 500 remains below its early 2022 peak, my impression is that far deeper market losses will emerge over the completion of this cycle. Investors often forget that the bulk of the 2000-2002 and 2007-2009 collapses occurred after the Fed “pivot,” and the Fed eased the whole way down. On the subject of bonds, I’ve noted previously that over the past century, the entire total return of long-term Treasury bonds, over-and-above the returns on Treasury bills, has accrued in periods when the 10-year Treasury yield was above the weighted average of Treasury bill yields (0.50), core CPI inflation (0.25) and nominal GDP growth (0.25).
The recent move in the 10-year Treasury yield above 4.2%, along with a broad range of other considerations, gets us closer to a neutral view on bonds. Even simple benchmarks can be helpful in gauging when yields are “adequate.” Bond yields tend to be highly adaptive and backward-looking, but can be less successful in looking ahead: since 1955, 10-year Treasury yields have had a correlation of nearly 0.9 with nominal GDP growth and core inflation over the previous decade, but a correlation of only 0.2-0.4 with nominal GDP growth and core inflation during the subsequent decade (the actual investment horizon of the bonds).
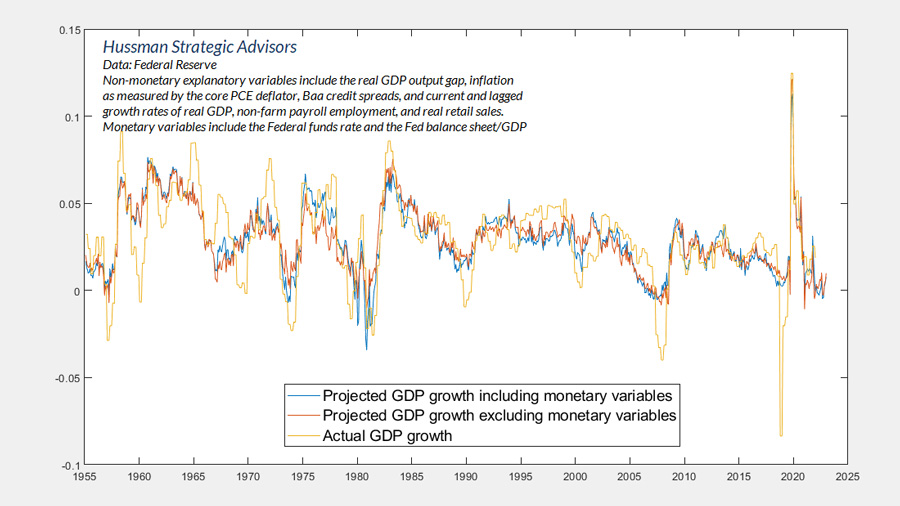
None of this implies that bonds can’t perform well despite inadequate yields, but it’s worth remembering that the yield you see when you buy a bond is the total return you get if you hold the bond to maturity. From a total return perspective, 10-year Treasury bonds have lost over -22% since late-2020, while 30-year Treasury bonds have lost about -45%. That’s something to remember when you hear the phrase “there is no alternative.” Still, those losses have clearly improved the prospects for future returns, unlike the equity market, where the S&P 500 remains near the most extreme valuations in history. Systematic policy, activist experiments, and “Granger causality” I’ve always found it disturbing when central bankers describe themselves as “data dependent,” yet actually refuse to use the data in a systematic way. Using data in the absence of a systematic policy framework is what’s called “operating by the seat of your pants.” It’s policy by feel-fact: using data to selectively justify one’s actions, based on assumptions that “feel” true, despite the fact that these assumptions can’t actually be demonstrated across history using that same data. Years ago, I attended an outdoor orchestra concert. As the orchestra played, a little boy stood up in the grass and began waving his arms like a conductor. If one was to look only at the little boy, one might have been forgiven for imagining that he was leading the orchestra. One would have observed a fairly good correlation between the boy’s movements and the “resulting” music. Of course, the music continued just the same even after he sat down on his blanket. We are used to hearing the phrase “correlation is not causality,” but that phrase doesn’t go far enough. There are many situations where it seems completely reasonable to believe that variable X causes variable Y. In those situations, we drop our guard, and we might even imagine that Y relies on X. That’s what has happened to monetary policy. We’ve come to believe that economic outcomes are controlled by the Federal Reserve, and our very financial existence relies on Fed support. Psychologists might describe this sort of mindset as an “illusion of control by proxy.” The problem here is that we’ve let down our intellectual guard. Decades ago, an economist named Clive Granger proposed a test for “causality” from X to Y. The key isn’t simply to test whether X helps to explain Y. The real key is to ask whether X provides incremental information, beyond what can be predicted from current and past values of Y alone. If X has independent impact, it should contribute incremental explanatory power. Otherwise, we’re testing whether the little boy is leading the orchestra, while ignoring information about the conductor. For example, suppose that Y is a “vector” of current and past economic conditions, say GDP growth, unemployment, inflation, real retail sales growth, the GDP output gap. It’s easy enough to form estimates of future values of Y based on current and past values of Y. Now we can ask this question: Does including information on monetary policy variables such as the Fed funds rate and the size of the Fed’s balance sheet improve our estimates of future Y in an economically meaningful way, relative to our estimates based on current and past values of Y alone? If information about monetary policy meaningfully improves our estimates, then we can conclude that monetary policy variables carry information and exert economic impact over and above the information provided by past non-monetary variables alone. If not, we’re left with two possibilities:
So what do we find in actual data? The chart below shows exactly this analysis applied to estimates of year-ahead real GDP growth. The red line shows estimates based on current and past values of non-monetary variables alone. The blue line, which includes information on monetary policy variables such as the Federal funds rate and the ratio of the Fed balance sheet to GDP, is almost indistinguishable.
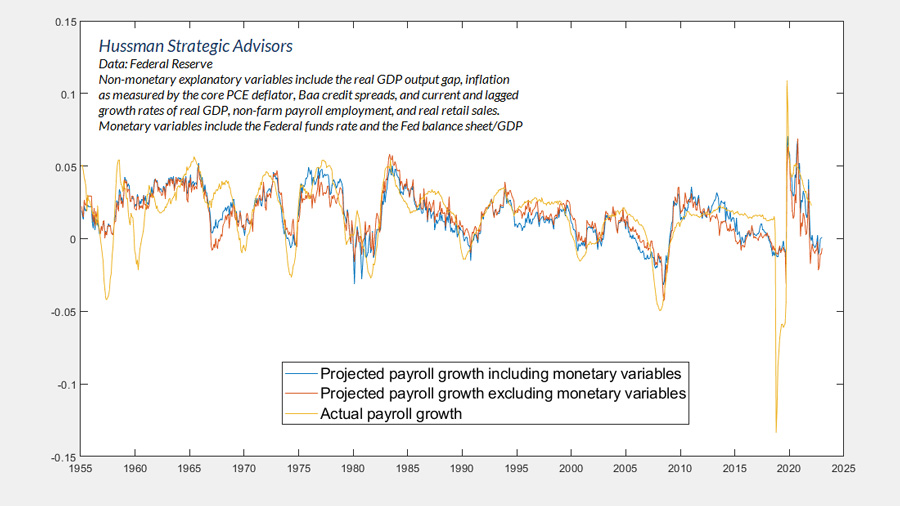
The two lines aren’t identical, but the differences are not large enough to be economically meaningful – certainly not to an extent that would justify trillion dollar balance sheet losses and the most extreme yield-seeking speculative bubble in history. One can torture an F-test into confessing that monetary policy has “significant” economic impact – which in statistics, is our way of saying we’ve got high confidence that the impact isn’t precisely zero. This hollow statistical conclusion is even easier to produce if one leaves variables like unemployment, the real GDP output gap, and real retail sales out of the vector of information. Papers like that are published all the time. The problem is that information about monetary policy does not have an economically meaningful impact, beyond what can be explained using purely non-monetary variables. The same is true for year-ahead growth in non-farm payrolls.
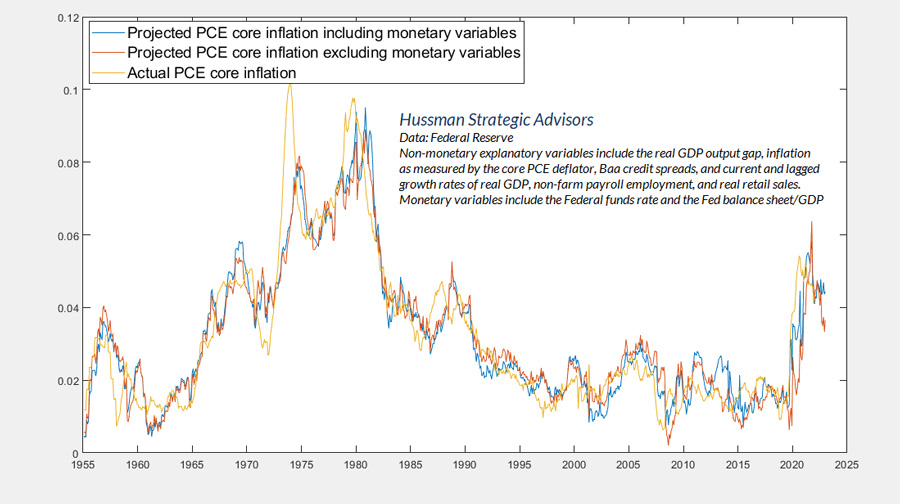
Strikingly, the same is true for core inflation. As a side note, both information sets imply year-ahead estimates for core PCE inflation well above the Fed’s 2% target. These projections may not be correct, but given that we prefer unbiased estimates over feel-facts, we wouldn’t be terribly surprised to see core inflation remaining in the 3-4% range even a year from now.
It’s worth repeating that these charts don’t demonstrate that monetary policy has zero impact on economic outcomes. Rather, they demonstrate that whatever benefit monetary policy might have, that benefit is captured in the systematic component – the part that responds to observable economic conditions in a consistent way.
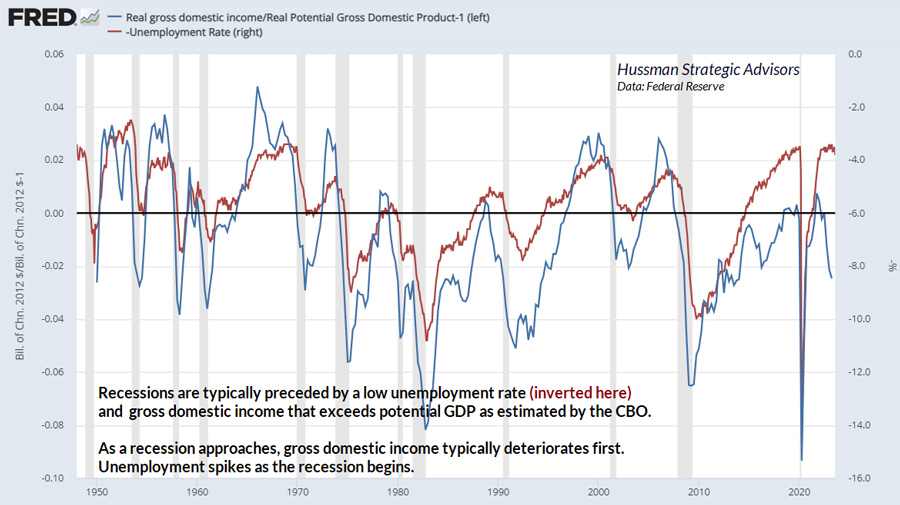
But wait. If Fed tightening isn’t what causes recessions, what does?
As an economic expansion progresses, slack in labor markets and productive capacity is gradually taken up. Supply shortfalls and backlogs begin to emerge. Gross domestic income expands beyond potential GDP (as estimated by the Congressional Budget Office). Price and wage pressures accelerate – symptoms of mismatched demand and supply. A central bank that adheres to systematic policy should be raising interest rates in that environment, ideally to help align demand with already tight supply, but if for no other reason, to telegraph its commitment to price stability. Yet even without Fed action, this is already a situation where recession is more likely. Businesses make errors in their projections and overexpand production. Small shifts in demand produce unprofitable errors. In my view, it’s not Fed tightening that causes recessions. Rather, Fed tightening precedes recessions that, because of tight capacity and emerging mismatches in the mix of goods and services supplied and demanded, were already more likely than not.
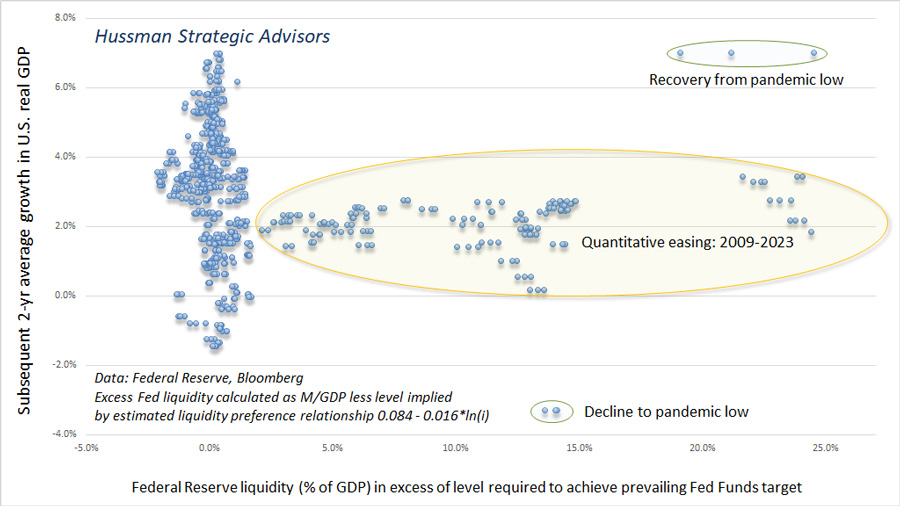
Needless liquidity and yield-seeking speculation Recall the earlier “liquidity preference” curve showing the relationship between the level of short-term interest rates and the size of the Fed’s balance sheet as a ratio of nominal GDP. Based on that relationship since 1929, we can easily calculate the amount of liquidity that was created by the Fed at each point in history, over and above the amount required to achieve the Fed’s interest rate target. If quantitative easing has economic benefits, we should find that this “excess liquidity” is meaningfully associated with subsequent economic outcomes. From the preceding charts, you already know that the answer is “it doesn’t,” but the following additional charts will hopefully drive that point home. The first chart shows excess Fed liquidity versus subsequent 2-year growth in U.S. real GDP. You’ll notice that for most of U.S. history, excess liquidity was virtually zero. That’s another way of saying that the level of interest rates was tightly related to, and determined by, modest changes in the size of the Federal Reserve’s balance sheet. That changed with quantitative easing. Yet despite the flood of excess Fed liquidity, there was no measurable impact on subsequent real GDP growth.
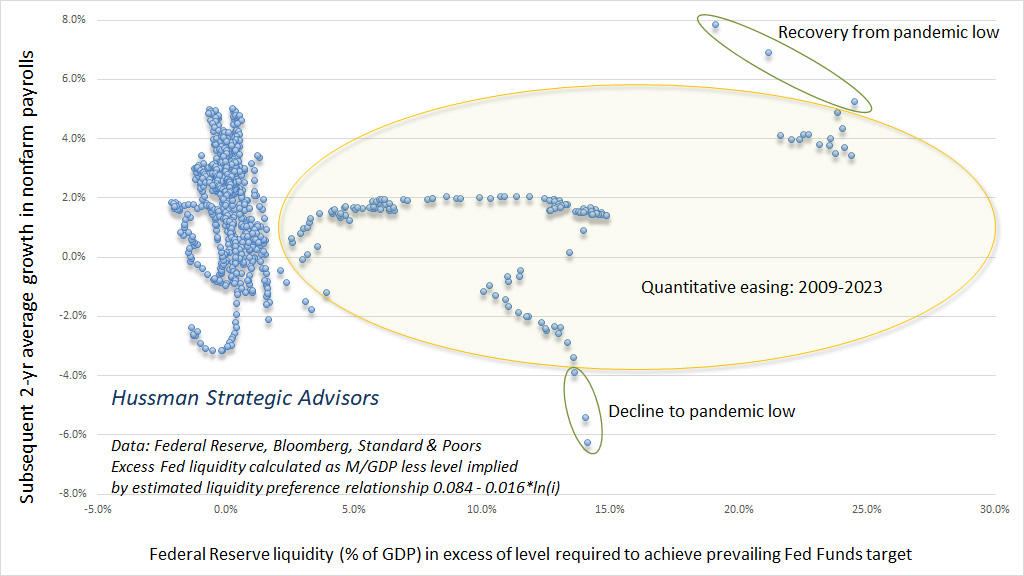
Likewise, growth in nonfarm payrolls shows no discernable relationship with excess liquidity.
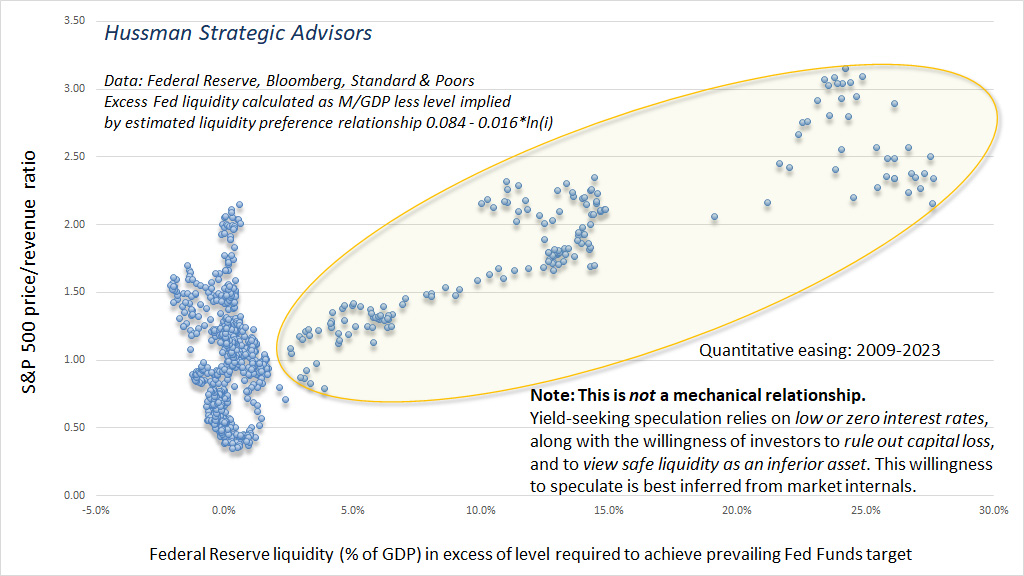
In stark contrast, however, we do find a clear relationship between excess liquidity and S&P 500 valuations, as measured by the price/revenue ratio. There’s no question that flooding the financial system with trillions of dollars of zero-interest liquidity encouraged speculation by investors who came to believe “there is no alternative.” Still, it’s essential to remember the two key elements that were responsible for the chart below. The first is that interest rates were zero. This is important, because it’s not liquidity itself that provokes speculation – it’s zero-interest liquidity. At present, investors are enjoying 5.4% on that liquidity, risk-free. That’s a far cry from zero, and a tidy 5.4% doesn’t provoke speculation. Second, we know from prior market collapses such as 2000-2002 and 2007-2009 that when investors become risk-averse, they treat low or zero-interest liquidity as a desirable asset, so creating more of the stuff doesn’t support the market. It’s when investors are inclined to speculate – to rule out the possibility of capital losses – that zero-interest liquidity is viewed as inferior. So yes, future quantitative easing might very well provoke future speculation, but remember that this is only a reliable expectation if a) interest rates are low or zero, and b) investors are inclined to speculate (which we infer from the uniformity of market internals). There’s no way to rule out future episodes of deranged zero-rate policy, but we’ve adapted our investment discipline to respond flexibly to that possibility.
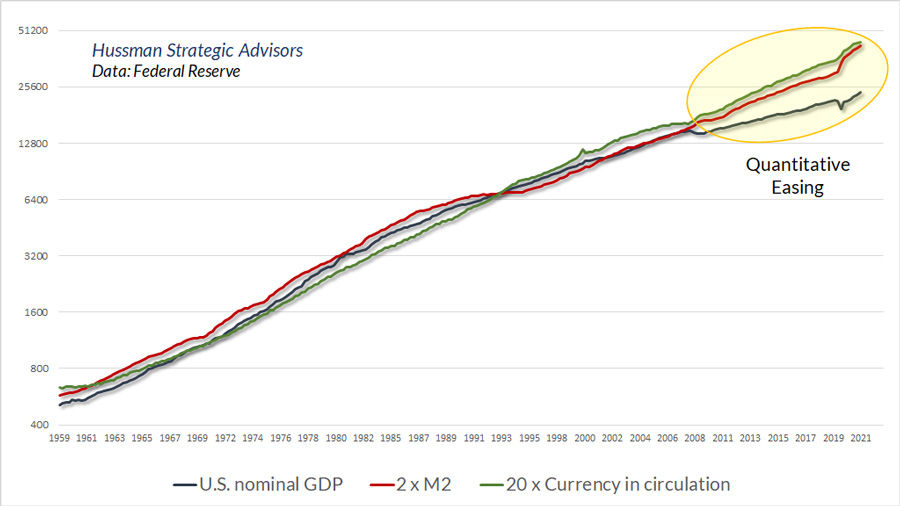
None of this should be a surprise. When the Fed creates more money and interest rates move lower, people don’t suddenly go out and consume goods and services. They simply reach for yield in more and more speculative assets such as mortgage debt, junk debt, and equities. Consumers don’t consume or abandon their retirement plans just because their assets have taken a different form. Businesses don’t invest just because their assets have taken a different form. The only activities that are stimulated by zero interest rates are those where interest rates are the primary cost of doing business: financial transactions and leveraged speculation. One of the fascinating aspects of quantitative easing is that despite the most aggressive expansion in Fed liquidity in history, commercial bank lending between 2008 and 2022 averaged just 3.4% annually, easily the slowest growth rate in history. What expanded in the banking system was zero interest cash, held indirectly by savers as bank deposits. That expansion destroyed the historical relationship between bank lending and bank deposits, as well as the relationship between the money supply and nominal GDP. Because the expansion of zero-interest liquidity encouraged persistent yield-seeking speculation, many investors seem to have concluded that money itself is a “fundamental.” We see this in the form of charts that overlay the S&P 500 versus M2 or currency in circulation, with little recognition that it was the zero-interest aspect of Fed liquidity, not just the quantity of liquidity itself, that promoted speculation among investors. The historical relationship between the money supply and the stock market exists because monetary aggregates were “co-integrated” with nominal GDP until 2009. They grew largely hand-in-hand, in accordance with the Fed’s Section 2A mandate. Bank deposits were a proxy for bank loans, and M2 was essentially a proxy for nominal GDP, until $8 trillion in zero-interest cash wedged a gap between financial quantities and economic quantities.
Again, forcing the public to choke down 36% of GDP in zero-interest liquidity did encourage unprecedented speculation. Yet amid this speculation, extreme valuations still imply poor long-term returns and steep full-cyclelosses. Meanwhile, low-yielding Fed liquidity is only treated as an “inferior” asset when investors are inclined to speculate. When investors are risk-averse, they treat that same liquidity as a desirable safe-haven. We can’t rule out future episodes of policy recklessness, but the appropriate response will still require attention to valuations and market internals. Central bankers wandering in the woods
What strikes me most about the attendee’s quote is how completely it overlooks the concept of systematic policy. Fed policy variables provide very little information about subsequent economic outcomes over-and-above the information available from non-monetary variables alone. The exception is economic crisis that inevitably follows interest rate suppression, yield-seeking speculation, and misalignment of monetary and economic quantities. “The crisis takes a much longer time coming than you think,” said the late MIT economist Rudiger Dornbusch, “and then it happens much faster than you would have thought.” In the meantime, as Paul Volcker observed, the delusion that Fed actions have tight and precise economic effects tends to feed “incessant debate in the Fed and the markets about which way should policy lean month-to-month or quarter-to-quarter with minute inspection of every passing statistic.” In my view, one can be a very effective central banker by taking just three things seriously:
Fed policy variables provide very little information about subsequent economic outcomes over-and-above the information available from non-monetary variables alone. The exception is economic crisis that inevitably follows interest rate suppression, yield-seeking speculation, and misalignment of monetary and economic quantities. Systematic policy improves the ability of individuals in the economy to plan for the future, without making the Fed the center of economic decision making; without bathing every financial discussion in speculation about what the Fed may or may not do. It helps investors to allocate capital based on considerations like productivity and expected future cash flows, rather than the hope for the next rate cut, or pivot, or forced risk-taking, without regard for valuations, driven by the psychological discomfort of zero interest rates. Activist, experimental and unsystematic policy, the hallmark of Federal Reserve policy for more than a decade, destabilizes expectations, promotes yield-seeking speculation, distorts financial markets, drowns the banking system in uninsured deposits, and subjects every corner of the economy to needless risk-taking, typically ending in chaos.
We don’t expect the current episode to end much differently. We do hope the Federal Reserve learns the right lesson this time around, but we’re fully equipped to navigate the financial markets even if they don’t. Keep Me InformedPlease enter your email address to be notified of new content, including market commentary and special updates. Thank you for your interest in the Hussman Funds. 100% Spam-free. No list sharing. No solicitations. Opt-out anytime with one click.By submitting this form, you consent to receive news and commentary, at no cost, from Hussman Strategic Advisors, News & Commentary, Cincinnati OH, 45246. https://www.hussmanfunds.com. You can revoke your consent to receive emails at any time by clicking the unsubscribe link at the bottom of every email. Emails are serviced by Constant Contact. The foregoing comments represent the general investment analysis and economic views of the Advisor, and are provided solely for the purpose of information, instruction and discourse. Prospectuses for the Hussman Strategic Growth Fund, the Hussman Strategic Total Return Fund, the Hussman Strategic International Fund, and the Hussman Strategic Allocation Fund, as well as Fund reports and other information, are available by clicking “The Funds” menu button from any page of this website. Estimates of prospective return and risk for equities, bonds, and other financial markets are forward-looking statements based the analysis and reasonable beliefs of Hussman Strategic Advisors. They are not a guarantee of future performance, and are not indicative of the prospective returns of any of the Hussman Funds. Actual returns may differ substantially from the estimates provided. Estimates of prospective long-term returns for the S&P 500 reflect our standard valuation methodology, focusing on the relationship between current market prices and earnings, dividends and other fundamentals, adjusted for variability over the economic cycle. Further details relating to MarketCap/GVA (the ratio of nonfinancial market capitalization to gross-value added, including estimated foreign revenues) and our Margin-Adjusted P/E (MAPE) can be found in the Market Comment Archive under the Knowledge Center tab of this website. MarketCap/GVA: Hussman 05/18/15. MAPE: Hussman 05/05/14, Hussman 09/04/17.
|
Send this article to a friend:
 |
 |
 |


![[Most Recent Quotes from www.kitco.com]](http://www.kitconet.com/images/live/s_gold.gif)
![[Most Recent USD from www.kitco.com]](http://www.weblinks247.com/indexes/idx24_usd_en_2.gif)
![[Most Recent Quotes from www.kitco.com]](http://www.kitconet.com/images/live/s_silv.gif)