|
|
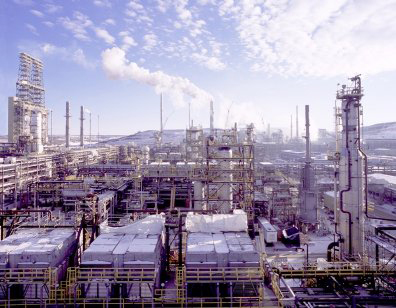
Suncor Energy: 10% Production Growth With No Exploration Risk
Based on its record oil sands production in April of 333,000 barrels per day and the potential to increase production 10% annually, SU’s current oil sands reserves could last between 50 and 100 years. The Alberta government's Energy and Utilities Board estimated in 2007 that a total of 173 billion barrels of crude bitumen are economically recoverable from the oil sands area. Unlike conventional reservoirs of liquid oil, the oil sands consist of a mixture of crude bitumen (a semi-solid form of crude oil), silica sand, clay minerals, and water. The oil sands are mined like coal, with 20% of the crude bitumen available through open-pit surface mining with the balance requiring deep-mining techniques. The bitumen is processed in “upgraders” that converts it into synthetic crude which is shipped to refineries in the US and Canada. The process is described in Wikipedia as:
Large amounts of natural gas and water are required to mine and convert oil sands ore into synthetic crude. Between 700 and 1,200 cubic feet of natural gas is required to create one barrel of oil with an energy equivalent of 6,000 cf of natural gas. The cost to convert oil sands is dependent on the price and availability of natural gas. As the production of oil sands increases over time, so will the demand for increasing amounts of gas. While not a current problem with the glut of gas today, over time increasing production of oil sands could divert Canadian natural gas available for export to the US. In mid-2009, SU acquired Petro-Canada to form Canada's largest oil company. One of the attributes of Petro-Canada is their Western Canadian natural gas resources that will be used to continue fueling expansion of SU’s oil sands projects. With the merger came a large amount of added debt for SU, and management is very active in divesting non-core holdings to reduce their debt. SU announced a continuation of debt-reducing assets sales this year, with $1.9 billion in sales since January. SU has active oil and gas production in Western Canada, offshore Canada, the North Sea, Libya, and Syria. SU also has refinery capacity and retail distribution. Merger synergies are progressing, and are estimated to generate savings in operating overhead of $400 to $500 million a year. Suncor’s first quarter 2010 results, along with 4th quarter ’09, were adversely affected by fires in their upgraders that reduced overall oil sands production. In addition, there is maintenance shutdowns scheduled for this year as well, some lasting 5 months. Both of these will hold back production and earnings this year. Total production has been declining since 2008, with this year estimated the largest decline of 8%, partially due to divestures. Production has decreased from 660 Mboe/d in 2008 (combined SU and Petro) to an estimated 600 this year. As a long term floor for production, going forward SU could produce 632 in 2011, 660 in 2012, and upwards of 740 by 2014, with strong growth from the oil sands. Management believes production can be increased annually by 10% over the next decade. Operating costs for converting to synthetic oil is substantially higher than for conventional oil development. Ongoing costs are in the $35 to $60 per barrel range. 1st qtr of 2010, management announced their costs were $55, due to lower production volumes. As costs are reduced per unit with higher volumes, it is estimated that cost per barrel will fall to between $ 38 and $41 by year end. Longer term, as the price of natural gas rises, so will the cost of oil sands conversion, however, these increases should be offset by higher market prices for synthetic oil, maintaining a comfortable net back. Suncor is a dual-listed stock on both the Toronto exchange and the NYSE with a market cap of $48.3 billion, has 1.56 billion shares outstanding and carries total debt of $13.3 billion. Earnings per share in 2009 were $0.92, and are estimated to be $1.60 this year, $2.80 in 2011 and upwards of $3.40 in 2012. Operating cash flow per share is expected to increase from $1.56 in 2009 to $4.10 this year, and to between $4.70 and $5.25 in 2011. Cash flow could top $6.50 to $7.00 in a few years. As with many in the oil industry, SU stock has shown some recent weakness, and its current price could provide a good long-term entry point. SU’s valuation matrix is historically higher than its peers, and this premium should be preserved. Based on 8 to 10 times projected cash flow, SU could reach the low $40s, with a longer-term price target of $50+. Suncor is overlooked by many investors. Its unique and sizeable oil sands assets, along with its large Canadian downstream operations, could be considered lower-risk (politically and operationally) but higher cost. If an investor is seeking a large cap oil stock, SU deserves to be on the list for further due diligence. Disclosure: Author long SU About George Fisher I have been a personal investor for over 45 yrs. I published a personal finance newsletter "Power Investing with DRIPs" from 1997 to 2004, and McGraw Hill has published two of my books - "All About DRIPs and DSPs" (2001) and "The StreetSmart Guide to Overlooked Stocks" (2002). From 1998 to 2002, NetstockDirect/Sharebuiler was my home for weekly investing commentary. I also have been a contributing columnist for the Canadian financial magazine "Canadian MoneySaver". My focus is on medium- to long-term stocks that most investors don't consider, on developing a diversified portfolio, and trading core holding positions. Hunting for value and fundamental analysis are the cornerstones of my stock selection. |
 |
 |

 Suncor Energy (