02
2013
April 02 2013 |
Reading the Dow vs. Gold Ratio, Part I
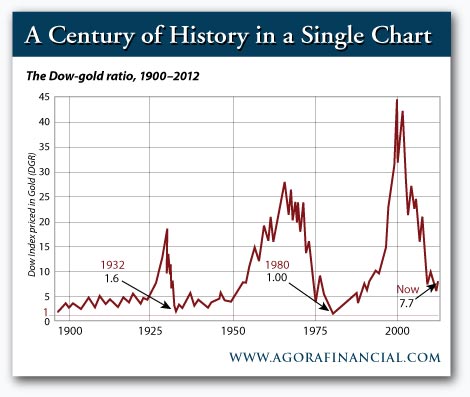
In February, Barry suggested that the long ugly bear market in stocks that began with the bursting of the tech bubble in 2000 is closer to the end than the beginning. His analogy was a baseball game in the seventh or eighth inning. Soon he found himself forced to write, in bold and all caps that we've faithfully preserved here: 'I DO NOT KNOW IF IT'S OVER.' Indeed. A few short weeks ago, the Dow Jones industrials were only 40 points off an all-time closing high. On Thursday, it went even higher, rising over 52 points, to close at 14,578. Whether the bear market is over or not is relevant to The Most Important Financial Question You Face - a question we explored in Apogee Advisory in July 2011. Today, we update the forecast... Midyear in 2011, we posed the question: Will US dollars have less or more purchasing power in the future? In early 2009, at the depths of the financial crisis, a gallon of gas cost $1.75. Deflation. After much up and down in the ensuing four years, it sits at $3.63 as we go to press. Inflation. Many were the nervous retirees glancing at dwindling 401(k)s, IRAs and individually directed accounts. Avoiding the drama, we replied: You don't have to get the answer right. It's a trick question. Fact is, you can use a simple yardstick... make one simple investing decision... and be right either way. The yardstick is the Dow-gold ratio: the Dow Jones industrial average divided by the price of gold.  Turning points in the Dow-gold ratio have coincided with turning points in market history: The stock market reached historic highs in 1929, 1966 and 1999 as the ratio did the same. Likewise, the market sat near historic lows in 1932 and 1980 as the ratio hit bottom. If history is any guide, the ratio is on its way back to the 2:1 or 1:1 levels of those historic lows. Of course, how we get there is critically important. In a severe deflation - think early 2009, but far worse - gold might retreat to US$1,000 an ounce and the Dow would sink to as low as 1,000. On the other hand, an episode of hyperinflation - think Weimar Germany and wheelbarrows of cash - could bring US$100,000 gold and a 100,000 Dow. Both of those are doomsday scenarios. We didn't think either one likely. Instead, we posited two 'plausible scenarios'.
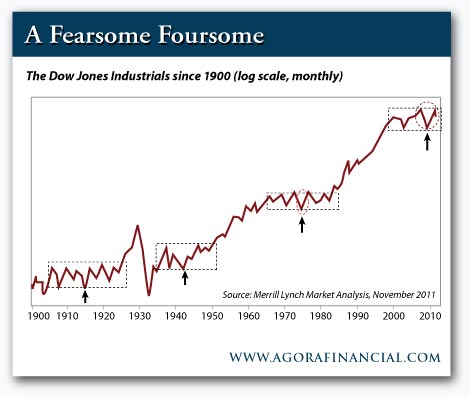
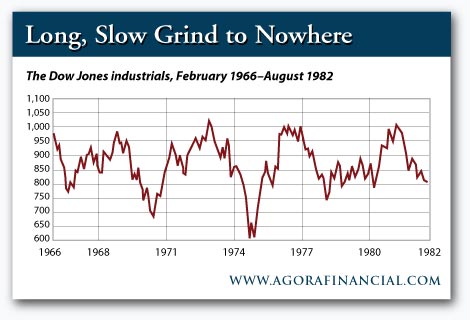
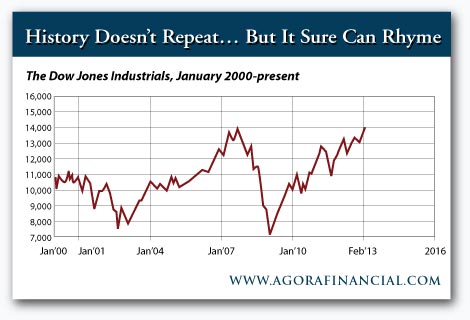
Back in 2011, we thought Mr. Rosenberg's scenario the more likely one. But the passage of 20 months since our original report has forced us to rethink. We've pored over the same charts we used to make our case in 2011... and reached a revised conclusion. Our new thinking is informed in part by our misunderstood friend Barry Ritholtz. In 2003, Barry held the lonely position that stocks had entered a new 'secular bear market' - a long-term period of up-and-down churning. His stance did not make him a hit at dinner parties - not at a time the Dow had roared up 27% from a low near 7,300 in October 2002. But his view lined up with our own in the original Trade of the Decade we unveiled in January 2000 – 'Sell stocks on rallies; buy gold on dips.' Barry's view was borne out as the Dow plumbed new depths of 6,549 in early 2009. 'Historically,' Mr. Ritholz writes, 'secular bear markets are extended periods of range-bound trading,' complete with 'vicious rallies and wicked sell-offs... within the larger timeline.' According to research from Fidelity, they typically last as little as 12 years and as many as 22. The average is 14½ years. During these ugly episodes, the market delivers a return of only 1%. And after you factor in inflation, it's actually a loss of 2.3%. We now sit in the midst of the fourth secular bear market since Charles Dow developed his famous index of industrial stocks in 1896. Each of the four is spotlighted in this chart from Merrill Lynch.  Let's zoom in on the third box of this chart -- the bear market that punished stockholders relentlessly from 1966-82. We shared it in our original report...  Now let's zoom in on the fourth box - the bear market that started when the tech bubble began to burst in early 2000:  Aside from 'vicious rallies and wicked sell-offs', the market hit bottom eight or nine years into the cycle. Sure, if you were a brilliant market timer, you could have bought at the bottom in 1974...but unless you invested as wisely as Warren Buffett did at the time, you didn't miss much by holding off until 1982, when a new secular bull market got under way. Each of the three bear markets preceding the current one has that same characteristic. It's the red arrows in the 'fearsome foursome' chart going back to 1900 - a bottom midway through the cycle, a number on the Dow that once hit is never to be seen again. Yet if you stayed out of the market another seven or eight years, you wouldn't have regretted it. In light of this recurring pattern, we now have the confidence to say the Dow will not return to its March 2009 low. A Dow of 6,549 will never be seen again. We'll explain why in tomorrow's Daily Reckoning. Stay tuned... Regards, Addison Wiggin for The Daily Reckoning Australia
Editorial director of The Daily Reckoning, Addison Wiggin is also the author, with Bill Bonner, of the international bestseller Financial Reckoning Day and a frequent guest on national US radio and television programs. Look for the sequel to Financial Reckoning Day, Empire of Debt (John Wiley & Sons) in October, 2005.
|
|---|
Send this article to a friend:
 |
 |
 |