March
05
2013
05
2013
|
March 05 2013 |
The Roadmap To $4,866 Gold Within 2 Years
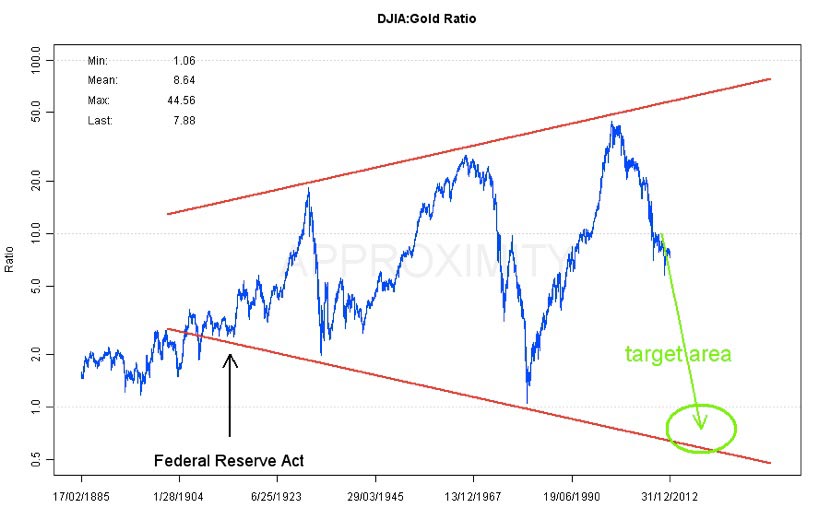
"Expressed differently, they seem to come in pairs. Further more, the rise within the pairs (1 to 2 and 3 to 4) was 34% and 41%, while from one pair to the next (2 to 3 and 4 to 5), if we assume that the most recent fifth spike belongs to a pair as well, it was 89% and 85%. If we take the middle of these respective moves, and also extrapolate the times between them into the future, we could try and guess what a sixth and a seventh price spike could look like (see also chart below). Our guess would be June of 2013 at $2,603.37 (spike 6) and January of 2015 at $4,865.73 (spike 7). So, should you be surprised if you would see a $1,000 move in gold in the first half of 2013? We think you shouldn't. 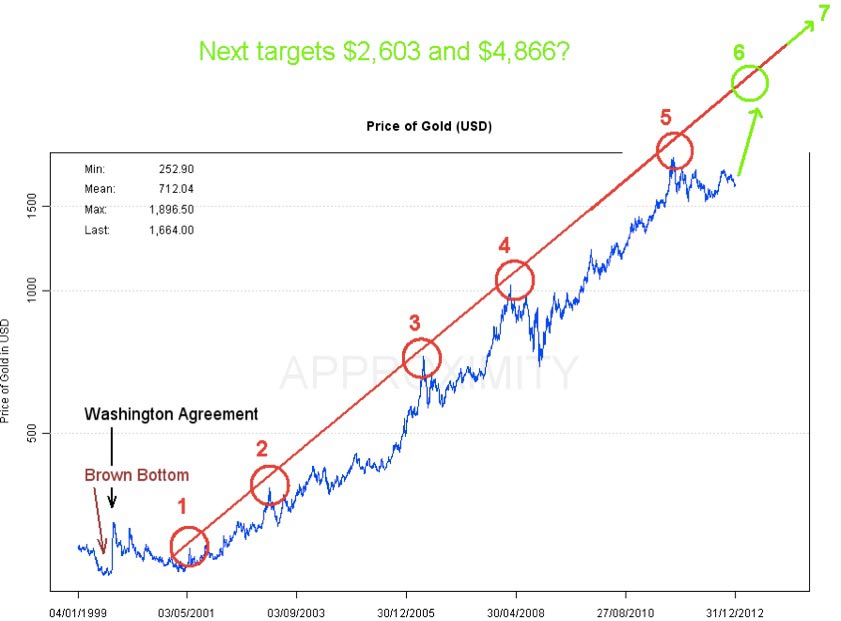 The chart below shows one of the potentially most important cycles in macroeconomics. It plots the Blue Chips of the U.S. industry (the Dow Jones Industrial Average) priced in ounces of gold. The chart shows that when one real asset (industry) is priced in another real asset (gold), one does not get ever increasing prices, but instead major price CYCLES. The chart implies that the amplitude of these DJIA:Gold cycles (possibly due to the increasing degree of leverage in the system) has ever grown since December 23, 1913, when the Federal Reserve Act established the second U.S. central bank, the "Federal Reserve" as we know it today. A target of the DJIA:Gold ratio below 1:1 seems possible.
|
|---|
Send this article to a friend:
 |
 |
 |