Are We In The Midst Of An Epic Battle Between Interest Rates And The Oil Price?
Rune Likvern,
 What follows is the continuance of my research, discussions, observations and thoughts around the nexus of debts, interest rates and the oil price. What follows is the continuance of my research, discussions, observations and thoughts around the nexus of debts, interest rates and the oil price.
I now believe these relations are poorly understood and with total global debt levels at all time highs (and growing), years of low interest rates, which are kept low (by concerted efforts by central banks) while the oil price in recent months has collapsed may hide a SIGNAL that struggles with attention from too much noise.
- A collapsing oil price while interest rates remain low is likely the proverbial canary.
Global Crude Oil Supplies, The Oil Price And Interest Rates
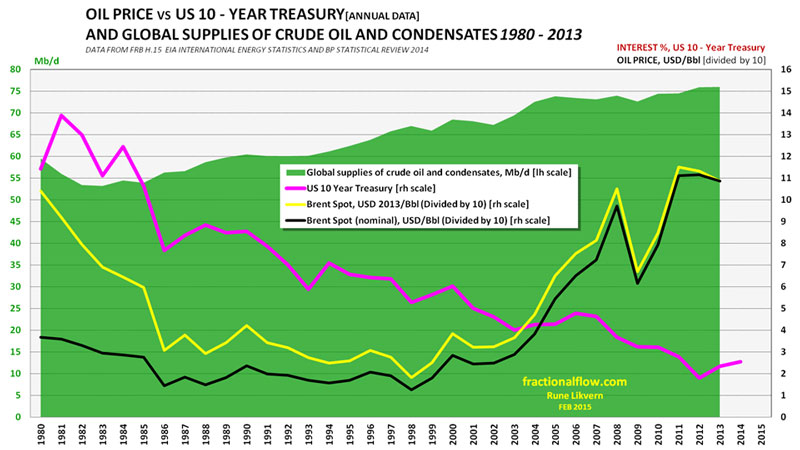
Figure 1: The green area [left hand axis] in the chart above shows the world’s development of crude oil and condensates supplies between 1980 and 2013.
The pink line shows the development in the interest rate (yield) for US 10 Year Treasuries [right hand axis].
The price of oil (Brent), black line nominal, yellow line inflation adjusted in $2013 [both right hand axis].
NOTE: The oil price has been divided by 10 to accommodate it on the same scale as the interest rate [right hand axis].
The US 10 Year Treasury (US10T) interest rate has been in decline and is presently around 2.0%.
Cause and effects amongst the oil price and interest rates are of course subject to (some informed and gripping) discussions.
- The price of oil appears to have been the leading indicator.
- Any (small) increase to the interest rate now will likely affect demand for oil and thus its price, thus further slowing investments for new supplies.
- The two oil shocks in the 1970’s with steep increases of the oil price contributed to growth in inflation, which Fed chairman at the time Paul Volker decided to fight with the interest weapon. The higher interest rate slowed private debt growth and demand for oil, which after some time also started to soften the oil price. This happened while supplies saw strong growth from new oil provinces like the North Sea, Alaska (Prudhoe Bay) and Western Siberia that benefitted from a higher oil price.
The debt leverage (total debt to GDP ratio) in the early 1980’s was much lower (refer also figure 3) which made the economy more resilient to high interest rates. In addition the US dollar was the world’s dominant reserve currency, which enabled the US economy to run a trade deficit and continue to grow.
The growth in the oil price came before the increase in the interest rate.
- The market mechanisms were at work; improved supplies and a decline in demand in the mid 1980’s brought the oil price down. This was followed by a lowering of the interest rate, which accelerated growth in credit/debt, refer also figure 3. This fueled growth in demand for oil.
It is worth noticing that the decline in the oil price came before the interest rate moved lower.
- The period that followed until the midst of the previous decade saw a low and predictable oil price which coincided with a steady decline in the interest rate and high growth rate for credit/debt, and thus in total debt.
- By the midst of the previous decade (2000’s) something changed. A global tight oil demand/supply balance was solved in the market by sending the oil price higher. If this contributed to the uptick in the US interest rate may be debated, but now there were other vigorous participants that had entered the equation, total debt levels (refer also figures 3 and 6) and there were also the aggressive credit/debt expansion in fast growing emerging economies, primarily China, that were able and willing to bid up the oil price (with credit!) while global supplies saw tepid growth.
- This culminated with the Global Financial Crisis (GFC) of 2008 where oil prices reached a high of $147/Bbl and then collapsed. Looking at historical data, this collapse was likely the major workings of a liquidity issue which was solved by concerted efforts from the world’s major governments (like the US Troubled Assets Relief Program [TARP]) and central banks that were determined to cut interest rates and started programs of Quantitative Easing (QE) to add liquidity.
These efforts relieved stresses of the total private debt burden and laid the groundwork to bring the economies back on their growth trajectories by temporarily increased government deficit spending to bridge a gap during which it was hoped the private sector would strengthen their balance sheets. The added liquidity, increased government deficit spending and strong credit/debt expansion in the emerging economies had the effect that these sustained a high global oil demand and gave support for growth in the oil price as from 2009.
Presently, due to the growing and total global debt load it takes less increases to the interest rate to affect oil demand and price.
- During the second half of 2014 the oil price collapsed. This time there were similarities and differences from both the mid 1980’s and 2008. Interest rates were low, total global debt is much higher and growing.
There is now a temporary structural imbalance between (over) supplies and demand, which softens support for the oil price.The recent collapse in the oil price apparently caught most by surprise. Even though it has now recovered from its (so far) low in mid Janaury 2015, a range of explanations has been offered to explain this like; “A dead cat bounce” to “$50/bbl oil is not sustainable”.
“However, other factors could have exacerbated the fall in oil prices. One important new element is the substantial increase in debt borne by the oil sector in recent years. The greater willingness of investors to lend against oil reserves and revenue has enabled oil firms to borrow large amounts in a period when debt levels have increased more broadly. Issuance by energy firms of both investment grade and high-yield bonds has far outpaced the already substantial overall issuance of debt securities.
The greater debt burden of the oil sector may have influenced the recent dynamics of the oil market by exposing producers to solvency and liquidity risks. Lower prices tend to reduce the value of oil assets that back the debt. Indeed, spreads on energy high-yield bonds widened from a low of 330 basis points in June 2014 to over 800 basis points in January; spreads on total high-yield debt have also widened, but not nearly as much. Against this background of high debt, a fall in the price of oil weakens the balance sheets of producers and tightens credit conditions, potentially exacerbating the price drop as a result of sales of oil assets (for example, more production is sold forward).”
The above quote and figure 2 has been lifted from the Bank for International Settlements (BIS) report “Global liquidity: selected indicators” of February 7th 2015.
Figure 2 right hand panel, illustrates that the energy companies became encouraged by the high oil price [higher revenues and asset valuations] and low interest rates to take on more debt in a bid to grow supplies. This bet was entered into on the presumption that consumers had both the abilities and willingness to take on more credit/debt to pay for costlier oil.
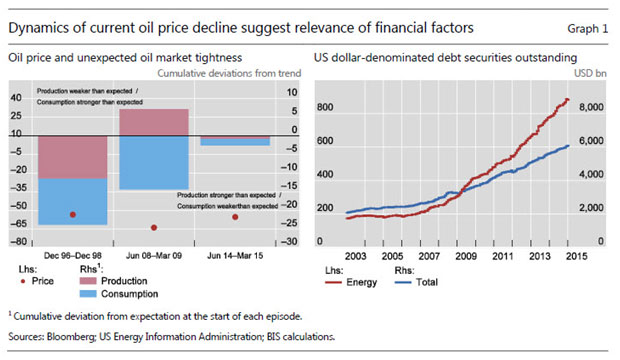
Figure 2: Left hand panel of the chart shows market tightness and right hand panel growth in energy sector’s debt which took off with the growth in the oil price.
BIS estimates a total of around US$9.2 Trillion in credit has been to non-bank borrowers outside the United States. The appreciation of the dollar and a possible increase in the Feds funds rate will make it harder for these economies to service their dollar denominated debt. This will likely affect demand from these countries as more local currencies are needed to service their dollar denominated debt.
US GDP, Growth in Private, Corporate and Public Debt and Interest Rates
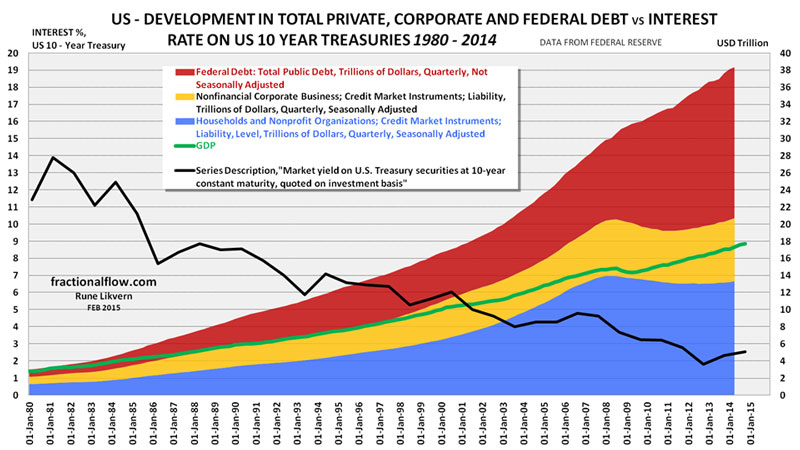
Figure 3: The stacked areas in the chart above shows developments in the US for total private [blue and orange, right hand scale] and public debt [red, right hand scale] together with US Gross Domestic Product (GDP) [green line, right hand scale] in nominal dollars as from Q1 1980 to Q1 2014.
The black line shows development in US 10 Year Treasuries as from 1980 to 2013 [annual figures and left hand scale].
Some point to that a low interest on US 10 year Treasury reflects a sentiment of expectations for low growth and low inflation.
Figure 3 shows several features of a modern economy:
- GDP growth during the last 3 – 4 decades was fueled by growth in total [private and public] credit/debt and growth in energy consumption. Note how total debt grew faster than Gross Domestic Product (GDP).
- As the private sector entered debt saturation (little room left for expansion on their balance sheets) in 2008 while interest rates declined, the public sector took over and continued growth in total debt and thus GDP.
- Note how total private debt accelerated with the decline in the interest rate early in the previous decade.
US private sector credit/debt went from 100% (of GDP) in 1998 to above 130% in 2007 when it crashed and as of 2013 it was down to 120%.
- After the GFC the US public sector took over growth in debt (through deficit spending) in an effort to bring economic growth (GDP) back on its trajectory.
Lowering the interest rate allows for growth in debt, incomes and GDP. It is really that simple!
Wage growth is also related to credit/debt growth and for households to have an increased debt potential on their balance sheets this requires growth in income and assets (values of homes, stocks etc).
Corporate started deleveraging in 2008, reached a low in late 2010 before it started assuming more debt, which grew by more than 20% from Q3 2010 to Q2 2014. This happened while debt funded extraction of shale gas and oil saw strong growth.
Post 2008 and declining interest rates, households for some time deleveraged and just recently with continued low interest rate started growing their debt. If history provides any guidance, low interest rates and a low oil price may encourage the households to assume more debt.
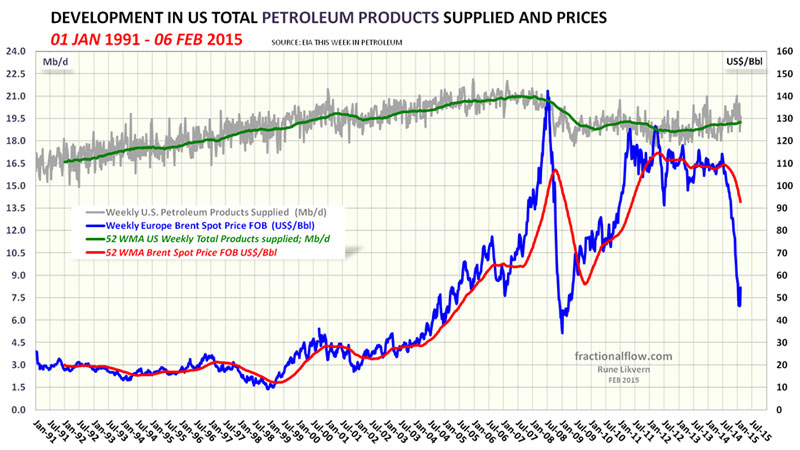
Figure 4: The chart shows development in US total petroleum consumption (annualized, green line) together with the oil price. Since the oil price started its rapid decline in June 2014, US annualized petroleum consumption is up less than 1%.
Growth in US petroleum consumption started during the summer of 2014 just as households debt started to grow again, refer also figure 3.
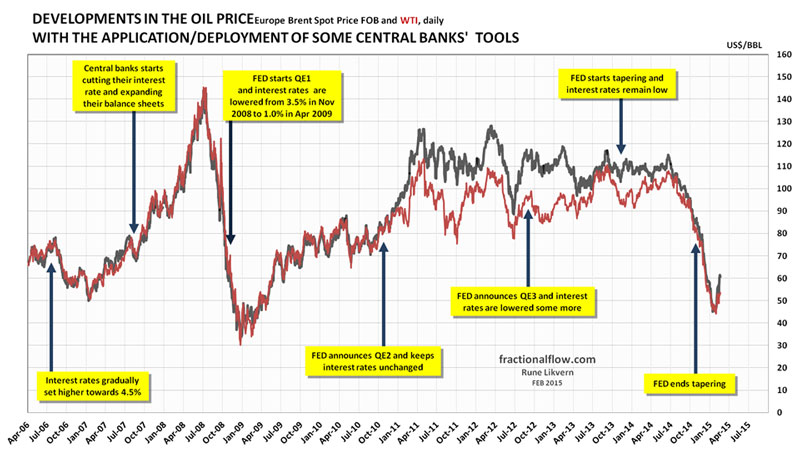
Figure 5: The chart above shows the developments in the oil price [Brent spot, black line and Western Texas Intermediate (WTI), dark red line] and the time of central banks’ announcements/deployments of available tools to support the global financial markets which the economy heavily relies upon. The financial system is virtual and thus highly responsive.
The chart suggests causation between FED policies and movements to the oil price.
Something apparently happened to the oil price as the market came to accept that the Fed was really going to taper and end its bond purchases under QE3.
Too much debt!
From the 84th BIS Annual Report, 2013/2014, published 29 June 2014;
“To return to sustainable and balanced growth, policies need to go beyond their traditional focus on the business cycle and take a longer-term perspective – one in which the financial cycle takes centre stage (Chapter I). They need to address head-on the structural deficiencies and resource misallocations masked by strong financial booms and revealed only in the subsequent busts. The only source of lasting prosperity is a stronger supply side. It is essential to move away from debt as the main engine of growth.”
From “Deleveraging, What Deleveraging?” The 16th Geneva Report on the World Economy, published 29 September 2014.
“The world has not yet begun to deleverage its crisis-linked borrowing. Global debt-to-GDP is breaking new highs in ways that hinder recovery in mature economies and threaten new crisis in emerging nations – especially China. This column introduces the latest Geneva Report on the World Economy. It argues that the policy path to less volatile debt dynamics is a narrow one, and it is already clear that developed economies must expect prolonged low growth or another crisis along the way.”
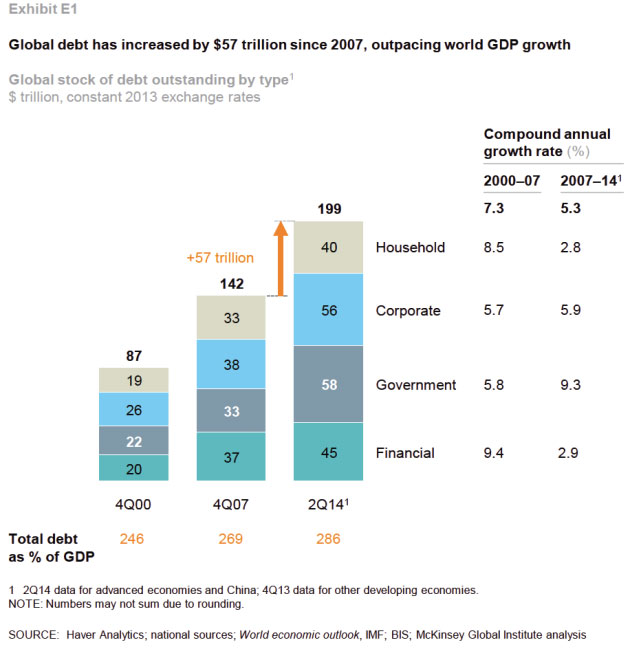
Figure 6: The chart above shows development in total global debt outstanding split on sectors.
In 2000 global Gross Domestic Product (GDP) was about $35 Trillion and by 2014 it had grown to about $70 Trillion. Source: McKinsey
The chart above has been lifted from the McKinsey report “Debt and (not much) deleveraging” from February 2015.
The slowdown in growth of household debt affects consumption.
- The chart above shows how GDP growth was buoyed by strong growth in credit/debt since 2000, refer also figure 3 for the US.
- The growth in debt was stronger than growth in GDP (orange numbers beneath the stacked columns).
As a response to the Global Financial Crisis (GFC) the world’s major central banks lowered the interest rates and deployed Quantititve Easing (QE) to add liquidity to the market.
The world’s major central banks have in concert used their iron grips to keep interest rates low both to ease the burden of servicing the growth in total global debt and allow for (some) more credit/debt expansion.
Iffor some reasons the interest rates breaks free from the central banks and moves upwards, this will slow credit/debt expansion and/or lead to deleveraging as more money becomes allocated to servicing debts thus leaving less for consumption which also affects commodity prices.
Some Recent Developments
Oil is the world’s most important commodity. History suggests that there has been and still are considerably relations between the oil price and interest rates.
For this reason I had a closer look at recent developments between the oil price (WTI) and the interest rate on US 10 Year Treasury (US10T). With the collapse of the oil price followed a decline in the US10T and the oil price was the leading indicator. Recently the oil price saw a rebound (from $44/Bbl to $53/Bbl (WTI) an increase of $9/Bbl in three weeks) and soon after the US10T moved from a low of 1.68% to 2.14% (an increase of 0.46% in about two weeks!), refer also figure 7.
To be clear, there are several other factors in play like the demand/supply balance, geopolitical events, volume and direction of carry trades, changes to exchange rates and stock changes [recently with strong stocks builds and speculators playing the forward curve] that also influence the oil price.
High interest rates appear in general to put a downward pressure on the oil price and vice versa. The logic behind that appears to be that a higher interest rate increases the amount allocated towards debt service, leaving less for other expenditures thus affecting prices on commodities. For what it is worth this may be illustrated:
An increase of 0.4% in the interest rate to a total global debt load at $200 Trillion adds about $800 Billion to the annual global debt service. This is equivalent to an increase in the oil price of around $25/Bbl with world annual consumption of 31 billion barrels (crude oil and natural gas liquids [NGL]).
- Low interest rate + Low oil price => Reduces CAPEX for costly oil + Eases debt service and stimulates credit/debt expansion => Stimulates oil demand which with time brings the oil price up.
- Low interest rate + High oil price => Increases CAPEX for costly oil + Eases debt service and stimulates credit/debt expansion => Stimulates oil demand and makes a high oil price easier to bear.
- High interest rate + Low oil price => Reduces CAPEX for costly oil + Weighs on debt service and slows credit/debt expansion => Softens oil demand as it makes it harder to bear a high oil price.
- High interest rate + High oil price => Increases CAPEX for costly oil + Weighs on debt service and slows credit/debt expansion => Softens oil demand and exerts a downward pressure on the oil price (ref also figure 1 and what happened in the early 1980’s).
High oil prices and high interest rates are a difficult combination as they slow organic economic development (growth).
Given that total global debt levels now are at all time high (and growing) these have become more sensitive to (small) moves in the interest rate. It appears as movements in the oil price and the interest rates are increasingly reciprocal. A rapid increase in the oil price forces the interest rate upwards and after some time with higher interest rates, it forces the oil price down.
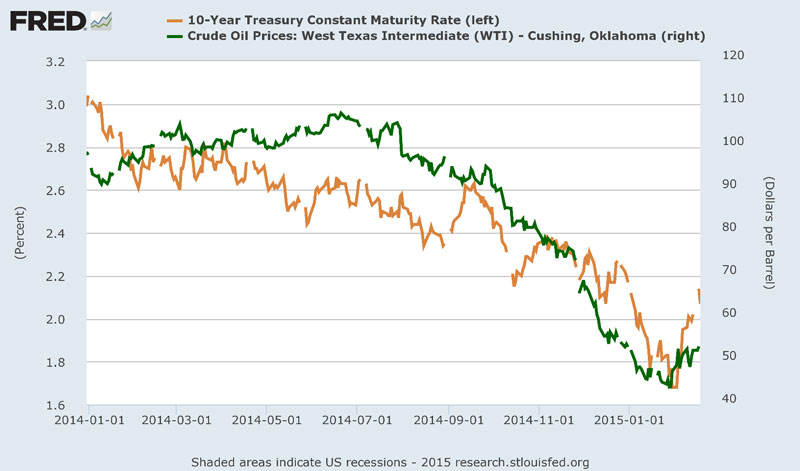
Figure 7: The chart above is from the Federal Reserve and shows developments in the US 10 Year Treasury (US10T, orange line, left hand sale) and the oil price (Western Texas Intermediate, WTI; dark green line and right hand scale). Data as of January 1st 2014 and February 19th 2015.
NOTE: None of the axis are zero scaled.
From figure 1 it appears the oil price has been leading the movements of the US 10 Year Treasury (US10T). Looking at the recent developments a stable oil price may have allowed the US10T to inch lower and the collapse of the oil price accelerated the decline of the US10T.
The recent rebound in the oil price happened before the US10T moved higher.
It may seem as the oil price and the interest rate is in a reciprocal interlock. The global economy would now find it helpful with both low interest rates and oil price. As the oil price tries to break upwards the interest rate responds by moving up to curb the upward movements of the oil price.
The total global debt now appears to make the economy more sensitive to changes of the interest rate than to the oil price.
So where is the oil price headed?
Predictions of the oil price has become a risk sport. Through the years and from studying/researching/discussing financial and oil data my expectations increasingly view fundamental future oil price movements to changes in the interest rate and total global debt.
Growth in total global debt appears now to approach a summit that in recent years became lifted, thanks to low interest rates by the major central banks. The interest rates were lowered to ease service of total debt and allow for growth in total credit/debt, and thus keep economic growth (GDP) on its desired trajectory.
- If sustained low(er) interest rates fail to keep the global credit/debt (and thus GDP) growth to the desired trajectory, this will slow oil demand and suppress the price of oil (and other commodities like iron ore and coal).
- If interest rates for whatever reasons starts moving upwards, this will not be helpful for the oil price as this will slow credit/debt growth and/or start deleveraging.
I now consider movements in the oil price as a proxy to changes in total global credit/debt.
Summary
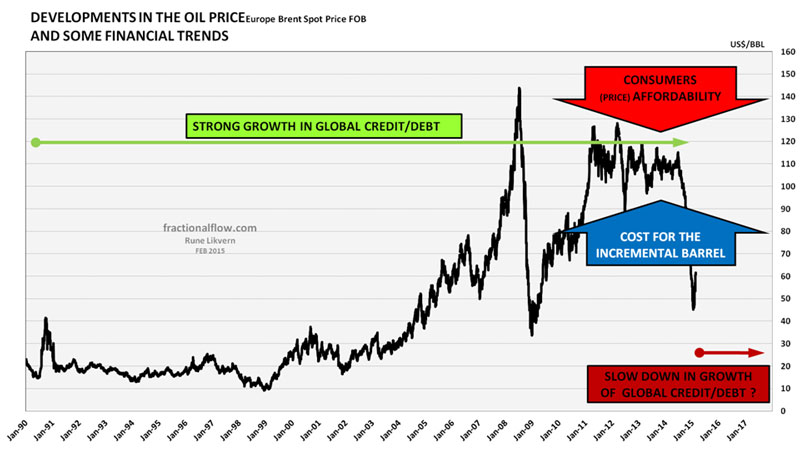
Figure 8: The chart shows the development in the oil price (Brent) and some major macro economic trends.
Growth in future supplies of crude oil is now apparently between the proverbial rock and a hard(er) place:
- For the oil companies the recent collapse in the oil price makes them cut and continue to cut in their capital expenditures (CAPEX) for exploration and development that should bring new and costlier oil supplies to the market (both offsetting declines from the legacy fields and adding growth) and at the same time allow for a decent return and strengthen their balance sheets.
- The consumers, battered by declines in their real disposable income and bloated balance sheets, find it harder to take on more credit/debt. The reality becoming that the costlier oil gradually becomes less affordable for them.
- The paradox in this situation is that the oil companies encouraged by the growth in the oil price since the mid 2000’s, which also was fueled by consumers’ credit/debt growth, took on more debt (increased leverage), thus betting on consumers’ abilities to continue to go deeper into debt to afford the costly oil that would allow the oil companies to retire their debts.
An increase in the interest rate will not be very helpful in this situation and bears with it the prospects of a lower oil price.
This describes the conundrum we are facing as a lasting, low oil price comes with possible inadequate (lower) supplies in the near future. A high oil price makes it harder for struggling economies to remain on their growth trajectory.
” …, but turmoil in many key consuming regions and the difficulties in formulating the right monetary policies mean the world may not be able to respond with adequate demand.”
|


